Download
1 / 1
10 likes | 102 Views
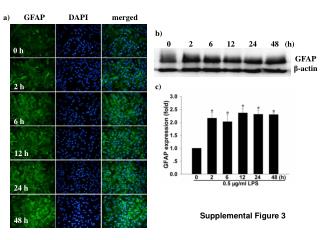
This study examines the expression levels of GFAP and β-actin at 0, 2, 6, 12, 24, and 48 hours post-treatment using immunofluorescence and DAPI staining. Supplementary Figure 3 shows merged images of GFAP, β-actin, and DAPI at each time point.

E N D
0 2 6 12 24 48 (h) GFAP β-actin a) GFAP DAPI merged b) 0 h 2 h c) 6 h 12 h 24 h SupplementalFigure 3 48 h