Download

1 / 6
60 likes | 163 Views
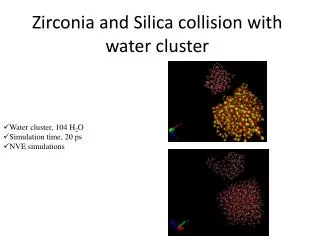
In the present investigation Zirconium oxide and silicon dioxide powders are exposed to Bio-field.

E N D
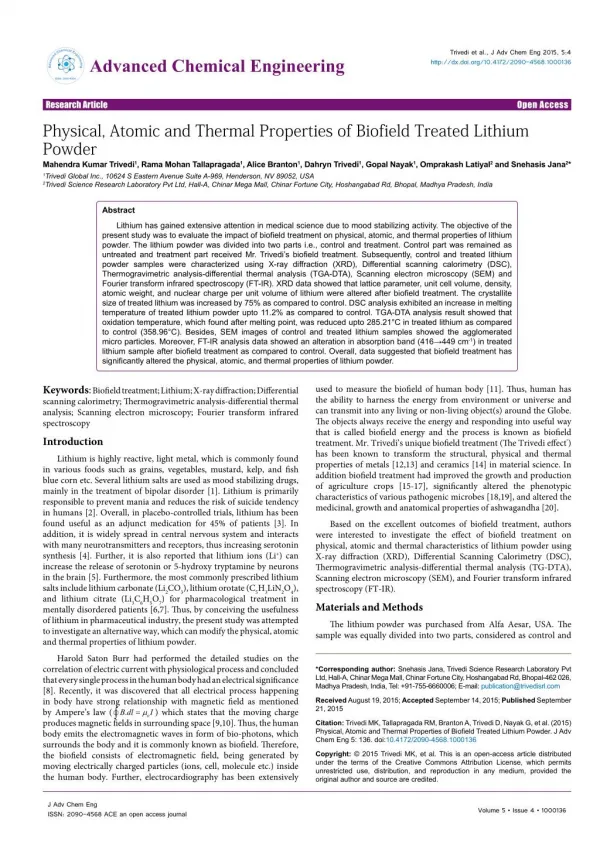
Trivedi et al., J Material Sci Eng 2014, 3:3 http://dx.doi.org/10.4172/2169-0022.1000144 Material Science & Engineering Research Article Research Article Open Access Open Access Atomic, Crystalline and Powder Characteristics of Treated Zirconia and Silica Powders Mahendra K Trivedi, Shrikant Patil* and Rama Mohan Tallapragada Trivedi Foundation, 10624 S Eastern Avenue Suite A-969, Henderson, NV 89052, USA Abstract Zirconium oxide and silicon dioxide powders are selected and subjected to a non-contact Biofield energy known to be transmitted by Mahendra Kumar Trivedi. Particle sizes d50 and d99 showed up to 71.5 percent decrease indicating that the energy had caused deformation and fracture as if the powders have been subjected to high energy milling. This is also supported by increase in specific surface area up to 19.48 percent. In the present investigation Zirconium oxide and silicon dioxide powders are exposed to Bio-field. Both the exposed and unexposed powders are later characterized by various techniques. The treated powders when characterized by X-ray diffraction are found to exhibit significant increase and decrease in the lattice parameters of the unit cell, crystallite size and density. The lattice parameters are then used to compute the molecular weight and total number of protons and neutrons in the molecule, which showed an increase up to 0.24 and decrease up to 0.31 percent. It is speculated that the Biofield energy transmitted by Mr. Trivedi is acting on the nucleus in the atoms through some reversible weak interaction of larger cross section causing changes in the proton to neutron ratios and thus energy to mass and mass to energy. Thus the effect is felt by all the atoms, and hence the unit cell, single crystal grain and grain boundaries. The stresses generated in turn may have caused deformation and fracture of the weak interfaces in the polycrystalline powders such as the crystallite and grain boundaries. Keywords: Biofield energy; ZrO2; SiO2; X-ray methods Introduction It is known that electrical currents along with their associated magnetic fields are present in human bodies. These are complex and dynamic mostly likely due to dynamical processes such as heart and brain function, blood and lymph flow, ion transport across cell membranes, and other biologic processes on many different scales [1]. Biofield is a cumulative effect exerted by these fields of human body on the surroundings. Typically, it may act directly on molecular structures, changing the conformation of molecules in functionally significant ways as well as may transfer bio-information through energy signals interacting directly with the energy fields of life. the atomic and molecular weights and charge on the bound atom there by indicating a conversion of energy to mass and vice versa. This is possible only when the neutron/proton ratio in the nucleus is changing possibly due to weak interactions inside the nucleus induced by this energy. More details can be obtained by referring to the web site [17]. In the present investigation we report the effect of Biofield energy on oxide ceramic powders. For this purpose we have selected powders of zirconium oxide and silicon dioxide. The powders after Biofield treatment are analyzed for particle size, specific surface area and crystal parameters. Large quantities of zirconium oxide and silicon dioxide are used in powder form in opacifiers. Zirconium oxide powders are extensively used in the manufacture of ceramics with high toughness. For this purpose the starting monoclinic zirconia should be as fine as possible so that when it is transformed the size of the transformed tetragonal zirconia will also be finer. Silicon dioxide is used in several traditional and engineering ceramics and the finer the powder the better will be the applicability. Experimental Zirconium oxide of particle size less than 5 µm (Sigma Aldrich, 99% pure) and -325 mesh silicon dioxide powders (Sigma Aldrich, 99.6% Mr. Mahendra. Kumar Trivedi is known to transform the characteristics of various living and non-living materials through biofield in his physical presence as well as through thought intervention. The effect on the yield and quality of agricultural produce such as Lettuce and Tomato [2], Ginseng and Organic Blueberry [3] and on Soybean [4] are reported. The impact of biofield treatment on growth and anatomical characteristics of the herb Pogostemon cablin used in perfumes, in incense/insect repellents, and alternative medicines is investigated [5]. The external energy aspects of Mr. Trivedi’s biofield and its influence on the antibiotic susceptibility and biochemical reactions of Staphylococcus epidermis [6], Yersinia enterocolitica [7] and on Enterococcus faecalis [8] are investigated. *Corresponding author: Shrikant Patil, Trivedi Foundation, 10624 S Eastern Avenue Suite A-969, Henderson, NV 89052, USA, Tel: +1-602-531-5400; E-mail: research@trivedifoundation.org Apart from atoms and molecules the next smallest sized materials available are powders. These could be single crystalline or polycrystalline the particle size of which is in the micrometric or nano metric range (<100 nm) [9,10]. Powders of about 2 μ particle sizes when subjected to high energy attrition milling for 15 hours yielded an average particle size of 35 nm [11]. It is therefore possible to produce large quantities of ultra-fine and nano powders by high energy milling. In separate communications we have demonstrated the use of Mr. Trivedi’s Biofield energy on the particle and crystallite sizes of metallic and ceramic powders [12-16]. This non-contact energy has also changed Received May 19, 2014; Accepted October 31, 2014; Published November 06, 2014 Citation: Trivedi MK, Patil S, Tallapragada RM (2014) Atomic, Crystalline and Powder Characteristics of Treated Zirconia and Silica Powders. J Material Sci Eng 3: 144. doi:10.4172/2169-0022.1000144 Copyright: © 2014 Trivedi MK, et al. This is an open-access article distributed under the terms of the Creative Commons Attribution License, which permits unrestricted use, distribution, and reproduction in any medium, provided the original author and source are credited. J Material Sci Eng ISSN: 2169-0022 JME, an open access journal Volume 3 • Issue 3 • 1000144
Citation: Trivedi MK, Patil S, Tallapragada RM (2014) Atomic, Crystalline and Powder Characteristics of Treated Zirconia and Silica Powders. J Material Sci Eng 3: 144. doi:10.4172/2169-0022.1000144 Page 2 of 6 the treated silica powders showed an increase in particle size. All the other powders showed a decrease. The percent change in particle size of various treated powders with respect to control powders is computed using the formula Change in average particle size d50 (%) = 100 x (d50t – d50c)/ d50c In a similar manner the change in particle size d99 (%) is computed. These values are given in Table 1 and the percentage variation is shown in Figure 1. All the treated powders showed a decrease in d50 and d99 up to 71.5%. However, d99 in treated zirconia powders showed an increase up to 21.1% and in one of the silica powders up to 3.4%. The smaller particles as indicated by d50 would have fractured at the inter particle and agglomerate boundaries there by reducing the d50 size. The lager particles on the other hand should contain less agglomerates and deformation of the individual particle along the slip planes would have taken place increasing the size prior to fracture. These results suggest that the particles may have elongated, work hardened and eventually fractured to smaller particles indicating that the Biofield energy had acted at the polycrystalline level causing deformation and fracture of particles as if the particles had undergone a high energy milling. Table 2 shows the BET surface area values of the control and treated powders. Figure 2 shows the percent change in the BET surface area of the treated powders of both zirconium oxide and silicon dioxide. The predominant decrease in size of fine particles as compared to coarser ones in treated zirconia powders might have resulted in an increase in surface area maximum up to 19.48%. The percent change in surface area values in treated silica powder showed a slight decrease up to 1.1% indicating that the decrease in size of fine particles is more or less compensated by increase in size of coarse particles. pure) of 99.5% purity are selected for experimentation. Five sets of each powder are prepared; the first set which is untreated is designated as control while the other sets exposed to Biofield energy are referred to as treated samples. The control and the treated samples are characterized by X-Ray Diffraction (XRD), Laser particle size analysis and Surface area determination (BET). Average particle size and size distribution are obtained using SYMPATEC HELOS-BF laser particle size analyzer with a detection range of 0.1 to 875 µm (micro meters). From the particle size distribution, d50 the average particle size and d99 (maximum particle size below which 99% of particles are present) for the control powders (untreated or as received powders) are taken as standard and are compared with the results obtained on four separately treated powders. Surface area determination is carried out on a SMART SORB 90 BET surface area analyzer with a measuring range of 0.2 to 1000 m2/g. X-ray diffraction is carried out using a powder Phillips, Holland PW 1710 XRD system. A copper anode with nickel filter is used. The wavelength of the radiation was 1.54056 Å (10-10 m or 10-8 cm). The data is obtained in the form of 2θ Vs Intensity chart as well as a detailed table containing 2θ0, d value Å, peak width 2θ0, peak intensity counts, relative Intensity %, etc. The ‘d’ values are compared with standard JCPDS data base and the Miller Indices h, k and l for various 2θo values are noted. The data are then analyzed using PowderX software to obtain lattice parameters and unit cell volume. Results Particle sizes d50 and d99are given in Table 1 for control and various treated powders. Only d99 in zirconia powders and in one of Treatment Particle Size In Micrometers Zirconium Oxide d50 d 99 2.6 7.6 2.9 9.2 0.87 8.2 0.74 7.6 0.74 8.3 Percent Change In Particle Size Zirconium Oxide d50 d 99 Silicon Dioxide d50 2.9 3 2.8 2.7 2.7 Silicon Dioxide d50 d 99 17 15.7 14.4 16.9 14.7 d 99 Control Treated T1 Treated T2 Treated T3 Treated T4 11.5 -66.5 -71.5 -71.5 21.1 7.9 0.0 9.2 3.4 -3.4 -6.9 -6.9 -7.6 -15.3 -0.6 -13.5 Table 1: Particle size of control and treated zirconium oxide and silicon dioxide powders. TREATED T1 TREATED T2 TREATED T3 TREATED T4 40 20 CHANGE IN PARTICLE SIZE % 0 d50 d 99 d50 d 99 ZIRCONIUM OXIDE SILICON DIOXIDE -20 -40 -60 -80 POWDER/ TREATMENT Figure 1: Percentage change in particle size in treated powders. J Material Sci Eng ISSN: 2169-0022 JME, an open access journal Volume 3 • Issue 3 • 1000144
Citation: Trivedi MK, Patil S, Tallapragada RM (2014) Atomic, Crystalline and Powder Characteristics of Treated Zirconia and Silica Powders. J Material Sci Eng 3: 144. doi:10.4172/2169-0022.1000144 Page 3 of 6 Bet Surface Area m2/g Percent Change In Bet Surface Area Zirconium Oxide Treatment Zirconium Oxide 3.34 3.96 3.99 3.93 Silicon Dioxide 4.54 4.51 4.55 4.49 Silicon Dioxide Control Treated T1 Treated T2 Treated T3 18.43 19.48 17.71 -0.71 0.14 -1.1 Table 2: BET surface area of control and treated powders. 25.00 CHANGE IN SURFACE AREA % 20.00 TREATED T1 TREATED T2 TREATED T3 15.00 10.00 5.00 0.00 ZIRCONIUM OXIDE SILICON DIOXIDE -5.00 POWDER/ TREATMENT Figure 2: Percentage change in BET surface area in treated powders. From Table 2 it can be noticed that the ‘a’ values obtained in the present experiments closely match the standard values. In most powders the Biofield energy used had changed the lattice parameter ‘a’ in the third decimal place and in some cases by second decimal place. What must be happening to cause these significant changes in particle size? In order to find a probable cause the powders have been examined by x ray diffraction. The data is obtained in the form of 2θ Vs Intensity chart as well as a detailed table containing 2θ0, d value Å, peak width 2θ0, peak intensity counts, relative Intensity %, etc. The ‘d’ values are compared with standard JCPDS data base and the Miller Indices h, k and l for various 2θ0 values are noted. The data are then analyzed using PowderX software to obtain lattice parameters and unit cell volume. The percent variation in unit cell volume in various powders after treatment is shown in Figure 3. While treated silica powders showed an increase up to a maximum of 0.23%, three of zirconia powders showed a decrease up to 0.31% and the other showed an increase by 0.24%. These changes are significant as 100×(Δa/ac) represents percent linear strain and any value above 0.2% strain is considered to be above elastic limit. Several attempts are being made to study the plastic deformation in ionic solids without much success as the samples invariably fail by fracture in the elastic region itself. Even then the elastic strain is expected to be released once the applied force is removed, which did not happen in the present experiments. Rather the strain was permanent indicating that it is plastic in nature and the lattice constant/ volume was permanently altered even though the crystal structure remained same. Then the crystallite size is calculated using the formula, Crystallite size = k λ/b Cos θ Where, λ is the wavelength of x-radiation used (1.54056×10⁻¹⁰ m) and k is the equipment constant with a value 0.94. The obtained crystallite size will be in nano meters or 10-9 m. Crystallite size in ceramics will be same as grain size or single crystal size. It is also possible that some part of the observed X-ray peak width could be due to the instrument broadening (already corrected) while the other part could be due to the strain in the crystal lattice. The change between various powders is assessed by using relative parameters as follows; The percent variation in crystallite size is shown in Figure 4. The crystallite size had increased up to 16.66% in both the powders while only one of the treated zirconia powders showed a decrease by 22.23%. In both the cases the crystal structure remained the same. The existence of severe lattice strains is evidenced by the change in lattice parameters. It is possible that these internal strains made dislocations to move on the slip planes and intersecting slip planes built in stress concentrations to such an extent causing the crystal to fracture at the sub boundaries. This is perhaps the explanation for decrease in crystallite size. On the other hand when the dislocations move unhindered, they might reorient the planes on either side of the crystallite boundaries resulting in an increased crystallite size. Percent change in lattice parameter is the ratio of difference in the values between control and treated samples to the value of control sample expressed as per cent. Typically for the parameter ‘a’ this is equal to 100 x (Δa/ac) where Δa = (at- ac)/ac. This is also known as strain, and, when multiplied with the elastic modulus gives the force applied on the atoms. When the force is compressive the change is negative while a positive value indicates a stretching or tensile force. In a similar manner the percent change in unit cell volume and crystallite sizes are computed. J Material Sci Eng ISSN: 2169-0022 JME, an open access journal Volume 3 • Issue 3 • 1000144
Citation: Trivedi MK, Patil S, Tallapragada RM (2014) Atomic, Crystalline and Powder Characteristics of Treated Zirconia and Silica Powders. J Material Sci Eng 3: 144. doi:10.4172/2169-0022.1000144 Page 4 of 6 0.3 0.2 CHANGE IN UNIT CELL VOLUME 0.1 0 ZIRCONIUM OXIDE SILICON DIOXIDE % -0.1 TREATED T1 TREATED T2 TREATED T3 TREATED T4 -0.2 -0.3 -0.4 POWDER/ TREATMENT Figure 3: Percentage change in unit cell volume in treated powders. 20 CHANGE IN CRYSTALLITE SIZE % 15 10 5 0 ZIRCONIUM OXIDE SILICON DIOXIDE -5 TREATED T1 TREATED T2 TREATED T3 TREATED T4 -10 -15 -20 -25 POWDER/ TREATMENT Figure 4: Percentage change in crystallite size in treated powders. Discussion The atomic size in a bound state is not constant and varies depending on the environment of nearest neighbors. Thus the lattice parameters are decided by the equilibrium inter atomic distance where the attractive forces due to nuclear charges are balanced by the repulsive forces due to the orbiting electrons. Thus the effective nuclear charge on the electrons decreases with increasing distance from the nucleus. When atoms in a molecule are subjected to an external compressive force the rather flexible electron cloud of the negative ion is likely to be pushed closer to the positive ion, thereby, decreasing the volume of the molecule. The reverse might happen when the external force is tensile. The atoms are likely to be pulled apart there by increasing the volume. Thus the density should increases during compression and decreases during tension. The reverse happens in the case of unit cell volume. The weight of the molecule is obtained from weights of the constituent atoms as per the molecular formula. The weight of individual atoms is computed from the sum of all electrons, protons and neutrons. Weight of atom = number of protons × weight of proton + number of neutrons × weight of neutron + number of electrons × weight of electron. Since the number of molecules per unit cell of the crystal is known, the weight of the unit cell is computed. The latter divided by the volume of the unit cell gave the theoretical density. The weight of the molecule when multiplied by the Avogadro’s number (6.023×10²³) gave the molecular weight (M) or the weight of a gram mole of the substance. The ratio difference in molecular weight between control and treated samples to the molecular weight of control J Material Sci Eng ISSN: 2169-0022 JME, an open access journal Volume 3 • Issue 3 • 1000144
Citation: Trivedi MK, Patil S, Tallapragada RM (2014) Atomic, Crystalline and Powder Characteristics of Treated Zirconia and Silica Powders. J Material Sci Eng 3: 144. doi:10.4172/2169-0022.1000144 Page 5 of 6 sample is then expressed as per cent change in molecular weight. Typically this is same as 100×(ΔM/Mc) where ΔM = (Mt-Mc)/Mc. This value also represents the percent change in sum of weights of protons and neutrons in the nucleus. The percent change in positive charge per unit volume is computed as follows; The computed values of the molecular weight and density together with the percent variation between control and treated samples are given in Table 3. The percent variation in molecular weight is shown in Figure 5. It can be noticed that although the individual values of the characteristics in various powders showed increase or decrease, the percent variation is same and is either directly or inversely proportional to the percent change in unit cell volume. Thus the percent variation in molecular weight linearly increases with increase in percent change in unit cell volume, with slope 1. A decrease in lattice parameter ‘a’ and unit cell volume increases the density. This in turn should decrease the size of the molecule. A decrease in size of the molecule indicates a decrease in metal-oxygen bond length and increase in bond energy. This is possible only if the polarizing power of the metal ion increases, which in turn signifies an increase in the nuclear charge. As density represents weight per unit volume and as the number of molecules per unit cell are fixed by the crystal structure, an increase in density corresponds to increased number of protons as compared to neutrons in the nucleus and hence to an increased charge of the metal atom. On the contrary the decrease in molecular weight indicates that there should be a decrease in total number of protons and neutrons. This is possible only if neutrons are participating in reversible weak nuclear reactions giving rise to neutrinos and charged particles. During the influence of tensile stresses the reverse is likely to happen. That is the lattice expands, density decreases, molecular weight increases and neutron to proton ratio increases. Thus, the opposing dependence of the atomic weight and atomic charge on the lattice parameters is possible only if it is assumed that nuclear reactions involving protons, neutrons with neutrinos resulting in electrons and positrons takes place. In other words the Biofield energy could be in the form of neutrinos interacting with atoms changing mass in to energy and vice versa. Conclusions The non-contact Biofield energy has significantly altered the characteristics of zirconium oxide and silicon dioxide powders as follows. • The decrease in particle size in treated powders up to 71.5% Zirconium Oxide Silicon Dioxide Zirconium Oxide Silicon Dioxide Lattice Parameter ‘a’ X 10-8 Cm % Change In ‘a’ JCPDS Standard 5.146 4.2563 Control 5.146 4.2553 -0.005 0.014 Treated T1 5.123 4.2559 -0.005 0.014 Treated T2 5.118 4.2602 -0.455 0.114 Treated T3 5.120 4.2577 -0.546 0.055 Treated T4 5.146 4.2585 -0.504 0.075 Volume of Unit Cell X 10-24 Cm % Change In Volume of Unit Cell Control 1.402E-22 1.130E-22 Treated T1 1.406E-22 1.131E-22 0.242 0.027 Treated T2 1.398E-22 1.133E-22 -0.305 0.227 Treated T3 1.400E-22 1.132E-22 -0.135 0.111 Treated T4 1.402E-22 1.132E-22 -0.051 0.150 Crystallite Size ‘G’ X 10-9 M % Change In ‘G’ Control 60.93 60.73 Treated T1 60.93 70.85 -0.01 16.66 Treated T2 71.08 70.84 16.65 16.66 Treated T3 Treated T4 47.39 71.08 70.84 70.84 -22.23 16.65 16.66 16.66 Zirconium Oxide Silicon Dioxide Zirconium Oxide Silicon Dioxide Molecular Weight (Weight of Number of Neutrons and Protons) g/g. mol % Change in Molecular Weight (Percent Change in Weight of Number of Neutrons and Protons) Control 124.06 60.49 Treated T1 124.36 60.50 0.242 0.027 Treated T2 123.68 60.62 -0.305 0.227 Treated T3 123.89 60.55 -0.135 0.111 Treated T4 124.00 60.58 -0.051 0.150 Density g/cc % Change In Density Control 5.875 2.666 Treated T1 5.861 2.666 -0.241 -0.027 Treated T2 5.893 2.660 0.306 -0.227 Treated T3 5.883 2.663 0.136 -0.110 Treated T4 5.878 2.662 0.051 -0.149 Table 3: Analysis of x-ray diffraction results of zirconium oxide and silicon dioxide powders. J Material Sci Eng ISSN: 2169-0022 JME, an open access journal Volume 3 • Issue 3 • 1000144
Citation: Trivedi MK, Patil S, Tallapragada RM (2014) Atomic, Crystalline and Powder Characteristics of Treated Zirconia and Silica Powders. J Material Sci Eng 3: 144. doi:10.4172/2169-0022.1000144 Page 6 of 6 0.3 CHANGE IN MOLECULAR WEIGHT % (PERCENT CHANGE IN WEIGHT OF 0.2 NUMBER OF NEUTRONS AND 0.1 PROTONS) 0 ZIRCONIUM OXIDE SILICON DIOXIDE -0.1 TREATED T1 TREATED T2 TREATED T3 TREATED T4 -0.2 -0.3 -0.4 POWDER/ TREATMENT Figure 5: Percentage change in molecular weight of treated powders (Change in weight due to total number of protons and neutrons). indicates that the Biofield energy employed is fracturing the powders most probably at agglomerate boundaries. The increase in particle size of larger particles up to 21.1% is not normally possible in ceramics and can only lead to the conclusion that the energy is causing deformation of the crystal without activating fracture paths. BET specific surface area of the treated powders showed an increase up to 19.48% confirming the decrease observed in particle size. Increase in crystallite size up to 16.66% is in accordance the observed increase in d99 particle size and is most likely due to deformation of the crystal taking place while suppressing fracture. The treated powders exhibited increase as well decrease in volume of unit cell, and the molecular weight. The percent change in these parameters is linearly dependent on the percent change in unit cell volume. We hypothesize that the changes caused by Biofield energy could be due to change in sum of protons and neutrons in the nucleus caused by weak interactions. 5. Patil SA, Nayak GB, Barve SS, Tembe RP, KhanRR (2012) Impact of biofield treatment on growth and anatomical characteristics of Pogostemon cablin (Benth). Biotechnology. 6. Trivedi M, Shrikant Patil (2008) Impact of an external energy on Staphylococcus epidermis [ATCC-13518] in relation to antibiotic susceptibility and biochemical reactions-An experimental study. Journal of Accord Integrative Medicine 4: 230-235. • 7. Trivedi M, Patil S (2008) Impact of an external energy on Yersinia enterocolitica [ATCC-23715] in relation to antibiotic susceptibility and biochemical reactions: An experimental study. The Internet Journal of Alternative Medicine. 8. Mahendrakumar Trivedi, Yogi Bhardwaj, Shrikant Patil, Harish Shettigar, Archana Bulbule, (2009) Impact of an external energy on Enterococcus faecalis [ATCC-51299] in relation to antibiotic susceptibility and biochemical reactions- An experimental study 5: 119-130. • 9. Suryanarayana C (1995) Nanocrystalline Materials. Int Mater Rev 40: 41-64. 10. Suryanarayana C (1999) Mechanical Alloying. In Non-Equilibrium Processing of Materials, Pergamon Materials Series, Pergamon Press, Oxford. • 11. Dabhade VV, Rama Mohan TR, Ramakrishnan P (2001) Synthesis of nanosized titanium powder by high energy milling. Appl Surf Sci 182: 390-393. 12. Trivedi MK, Tallapragada RM (2008) A transcendental to changing metal powder characteristics. Met Pow Rep 63: 22-31. 13. Dabhade VV, Trivedi MK, Tallapragada RM (2009) Effect of external energy on the atomic, crystalline, and powder characteristics of antimony and bismuth. Bull of Mat Sci 32: 471-479. Acknowledgements 14. Trivedi MK, Tallapragada RM (2009) Effect of super consciousness external energy on atomic, crystalline and powder characteristics of carbon allotrope powders. Mat Res Inno 13: 473-480. We thank Dr. Cheng Dong of NLSC, Institute of Physics, and Chinese academy of Sciences for permitting us to use PowderX software for analyzing XRD results. References 15. Trivedi MK, Patil S, Tallapragada RM (2013) Effect of Bio Field Treatment on the Physical and Thermal Characteristics of Vanadium Pentoxide Powders. J Mat Sci Eng S11-001. 1. Rubik B, Becker RO, Flower RG, Hazlewood CF, Liboff AR et al. (1994) Bioelectromagnetics applications in medicine. In Alternative Medicine: Expanding Medical Horizons. Washington, DC: U.S. Government Printing Office. 16. Trivedi MK, Patil S, Tallapragada RM (2013) Effect of bio field treatment on the physical and thermal characteristics of Silicon, Tin and Lead powders. J Material Sci Eng 2:125. 2. Shinde V, Sances F, Patil S, Spence A (2012) Impact of Biofield Treatment on Growth and Yield of Lettuce and Tomato. Australian Journal of Basic and Applied Sciences 6: 100-105. 17. Trivedi Science. 3. Sances F, Flora E, Patil S, Spence A, Shinde V (2013) Impact of Biofield Treatment on Ginseng and Organic Blueberry Yield. Agrivita, Journal of Agricultural Science. 4. Lenssen AW (2013) Biofield and Fungicide Seed Treatment Influences on Soybean Productivity, Seed Quality and Weed Community, Agricultural Journal 8: 138-143. Citation: Trivedi MK, Patil S, Tallapragada RM (2014) Atomic, Crystalline and Powder Characteristics of Treated Zirconia and Silica Powders. J Material Sci Eng 3: 144. doi:10.4172/2169-0022.1000144 J Material Sci Eng ISSN: 2169-0022 JME, an open access journal Volume 3 • Issue 3 • 1000144