Download
1 / 22
220 likes | 768 Views
Exercises Graph the following functions. Solutions will follow the exercises. Exercise Solutions The following graph solutions are done in blue. The asymptotes are done in red. 1. 2. Notice the difference in the equations of 1 and 2 and then compare the difference in the graphs of 1 and 2.

E N D
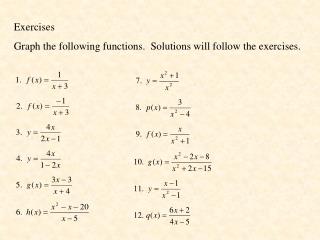
Exercises Graph the following functions. Solutions will follow the exercises.
Exercise Solutions The following graph solutions are done in blue. The asymptotes are done in red.
2. Notice the difference in the equations of 1 and 2 and then compare the difference in the graphs of 1 and 2.
4. Again notice the difference in the equations of 3 and 4 and then compare the difference in the graphs of 3 and 4.
6. (5, 9) Complete solution at the end.
9. Complete solution at the end.
10. Complete solution at the end.
6. h(x) x y • 9 hole • 0 4 Complete solutions for problems 6, 9, and 10, First we need to ask ourselves, “Does the function reduce?” Yes, in fact, it reduces to a linear function which is restricted at x = 5. This means that when x = 5, there is a hole in the graph.
9. First we need to ask ourselves, “Does the function reduce?” No! Next we need to graph the horizontal and vertical asymptotes. Looking at the denominator, if we set it equal to 0, we get imaginary values for x. This means that there is no vertical asymptote. We can also see that since x2 is always positive and adding 1 to x2 is always positive, the denominator is always positive and can never be equal to zero.
Since the numerator degree is smaller than the denominator degree, the horizontal asymptote is y = 0. This line is shown in red. Sometimes the function crosses the horizontal asymptote. Huh, something new! So, after asymptotes are drawn, we need to check and see if the function crosses the horizontal asymptote
The horizontal asymptote is defined by the line y = 0. I will call the number 0, the “horizontal asymptote value” for this function. Any line or curve which crosses this red line will have a y value of zero at the point of crossing. All we need to do is find the x value that goes with this y value of 0. If we set the function equal to 0 and solve for x, we will have the x value which corresponds to the y value of 0. Multiplying both sides by the LCD, we get x = 0 Therefore, the point, (0, 0) is on the function and is also on the horizontal asymptote. Hence the function crosses the asymptote at (0, 0). When a function does not cross the horizontal asymptote, the above process will yield a false statement, meaning there is no solution…there is no x value that corresponds to a y value of 0.
The point of crossing has been emphasized with the red dot. Since there are no vertical asymptotes, we will find a few points to the left of this point of crossing and a few points to the right: (-3, -.3), (-2, -.4), (-1, -.5), (-.5, -.4), (.5, .4), (1, .5), (2, .4), (3, .3). Since y = 0 is an asymptote, the function must approach it and the only point of crossing was found to be (0,0). Connecting the dots and approaching the asymptote on both ends gives us the graph of the function.
Does the function reduce? 10. No Vertical Asymptotes: x = -5 and x = 3 Horizontal Asymptote: y = 1 Does the function cross the horizontal asymptote? To find out, set the function equal to the “horizontal asymptote value”.
Multiply both sides by the LCD and solve. x2 – 2x – 8 = x2 + 2x – 15 -4x = -7 x = 1.75 The function crosses the “H. A.” at (1.75, 1). Now we must plot at least one point on each side of both Vertical Asymptotes and one point on each side of the point of crossing. These points show us which quadrant the function lies for each section of the graph defined by the “V. A.s”
With our knowledge of how functions behave close to their asymptotes and the fact that the function crosses the horizontal asymptote in only one point, we can now draw the function. If you are uncomfortable doing this with only one point in each section, you can, of course, plot more points. Note: Functions never cross vertical asymptotes.