Download
1 / 22
220 likes | 566 Views
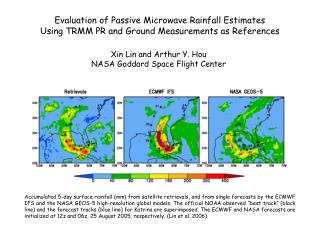
An Analysis of Intensity Estimates of the Advanced Microwave Sounding Unit (AMSU), 2005-2007. Corey Walton NHC SCEP Intern August 7, 2008. Purpose. To provide information on the accuracy of the AMSU method of estimating tropical cyclone intensity for the 2005 to 2007 hurricane seasons.

E N D
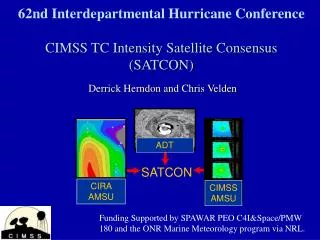
An Analysis of Intensity Estimates of the Advanced Microwave Sounding Unit (AMSU), 2005-2007 Corey Walton NHC SCEP Intern August 7, 2008
Purpose • To provide information on the accuracy of the AMSU method of estimating tropical cyclone intensity for the 2005 to 2007 hurricane seasons. • To compare the AMSU method with the Dvorak method (TAFB/SAB) for the 2005 through 2007 hurricane seasons when aircraft reconnaissance is available.
General Overview • Used ATCF database for all data retrieval • Includes both the Atlantic Basin and the Eastern Pacific Basin • Data points require reconnaissance flight data within 2 hrs of the time the AMSU data was taken • Wind estimate comparisons only (kts) • Used both CIMSS and CIRA AMSU real time estimates and the TAFB and SAB Dvorak estimates
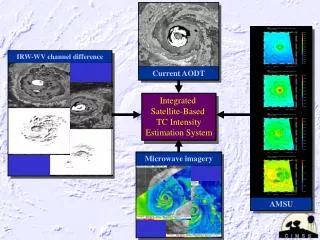
AMSU (in general) • Microwave sounder which includes channels for measuring brightness temperatures (Tb) • AMSU-A (temperature, 15 channels) and AMSU-B (moisture, 5 channels) 1998-present • Resolution: ~50km at nadir, ~100 km at limb • Temperature anomaly directly related to TC intensity / size (completely independent of Dvorak) • No dependence on previous estimate -Used with permission of Derrick Herndon
CIMSS AMSU-A channels 5-8 AMSU-B channel 16 Corrections applied to account for sub-sampling and scan geometry. Uses only TC data within 6 hours of recon Depends on RMW and P_env Uses multiple regression scheme directly from AMSU channels to get MSLP MSLP used to get corresponding MSW Updated annually CIRA AMSU-A, 23 pressure levels No sub-sampling correction for resolution Uses any best track data for regression Relies on model data for boundary conditions Uses AMSU channels to get temperature and wind fields and then multiple regression scheme to get MSLP and MSW separately Known to work well in higher latitudes Last update in 2005 CIMSS vs. CIRA -Used with permission of Derrick Herndon
Data Division Overview • Subdivided by Year (2005,2006,2007) • Subdivided by homogeneity* • Combined Data (all years 2005-2007) • Subdivided by homogeneity* • Subdivided by intensity • Subdivided by size *Homogeneity is determined by having all values (CIMSS, CIRA, TAFB, SAB) for a single time. Also divided by being homogeneous for only AMSU or Dvorak.
2005 Findings • Season Notes • Most active year in history (28 total storms) • 7 major hurricanes: Dennis(4), Emily(5), Katrina(5), Maria(3), Rita(5), Wilma(5), Beta(3) • Data Set includes these storms: Arlene, Bret, Cindy, Dennis, Emily, Franklin, Harvey, Irene, Jose, Katrina, Ophelia, Philippe, Rita, Stan, Tammy, Wilma, Beta, Gamma 2005 Track Map
2006 Findings • Season Notes • Season less active than anticipated • Total of 10 storms (AT), with 2 major hurricanes (Gordon and Helene) • Data Set includes these storms: Chris, Ernesto, Florence, Gordon, Helene, John (EP), Lane (EP) 2006 Track Map
2007 Findings • Season Notes • Total of 15 tropical cyclones, including 2 major hurricanes, both Cat 5 (Dean and Felix) • Data Set includes these storms: Andrea, Barry, Dean, Erin, Felix, Gabrielle, Humberto, Ingrid, Lorenzo, Noel 2007 Track Map
Combined Findings (2005-2007) • Notes • Distribution of data set: • 2005: 68 data values • 2006: 33 data values • 2007: 27 data values • Data set from a total of 35 tropical cyclones, including 10 major hurricanes
Intensity Subdivision Findings • Divided into three groups: • Tropical Depressions and Tropical Storms • Category 1 and 2 Hurricanes • Category 3, 4 and 5 Hurricanes
Size Subdivision Findings • Size determined by Radius of Max Wind (RMW) • Divided into three categories: • Small: RMW 5-15 nm • Medium : RMW 20-30 nm • Large: RMW 35+ nm
Conclusions • CIMSS AMSU more reliable than CIRA in most cases • Overall, CIMSS AMSU is competitive with Dvorak for 2005-2007 hurricane seasons • Both CIMSS and CIRA AMSU are competitive with Dvorak for storms with an RMW of 20 nm and greater and outperforms Dvorak for storms with an RMW of 30 nm and greater • CIRA AMSU is competitive with Dvorak for TD’s and TS’s • CIMSS AMSU outperforms Dvorak for TD’s and TS’s
For the Future • In process of obtaining confidence levels for all AMSU cases (help to remove outliers when confidence not high) • Stratify by storm latitude and evaluate statistics • Add ADT values for comparison • Will add 2008 TC’s to database and will reevaluate statistics after the season • The AMSU techniques (esp CIMSS) undergoes revisions which will need to be evaluated • Evaluate AMSU 34 kt wind radii technique from CIRA