Download
1 / 17
170 likes | 571 Views
Overhead Variances and Management Control: II. Chapter 8. Overview: Overhead Variances. VOH vs. FOH Features of a standard-cost system Calculation of VOH variances VOH Efficiency variance Calculate FOH variances Production-volume variance—meaning 4, 3, 2, 1 OH variance analysis

E N D
Overview: Overhead Variances • VOH vs. FOH • Features of a standard-cost system • Calculation of VOH variances • VOH Efficiency variance • Calculate FOH variances • Production-volume variance—meaning • 4, 3, 2, 1 OH variance analysis • J.E.s for MOH variances—which are favorable? • Balanced Scorecard
Standard Cost System • Simple recording system • Cost to run system is relatively low. All output units are costed at standard—no need to keep track of the actual costs/unit or the use of allocation bases.
VOH Variances: useful approach to calculate Actual“no name”FlexibleBudget Actual $VOH AQ Alloc.base used X BR/unit Alloc.base For actual output: BQ Alloc.base X BR/unit Alloc.base For budget output: BQ Alloc.base X BR/unit Alloc.base |----------------------------SBV--------------------------------------| |----------------FBV------------------------|----------SVV---------| |----Spending V-----|------Efficiency V------|
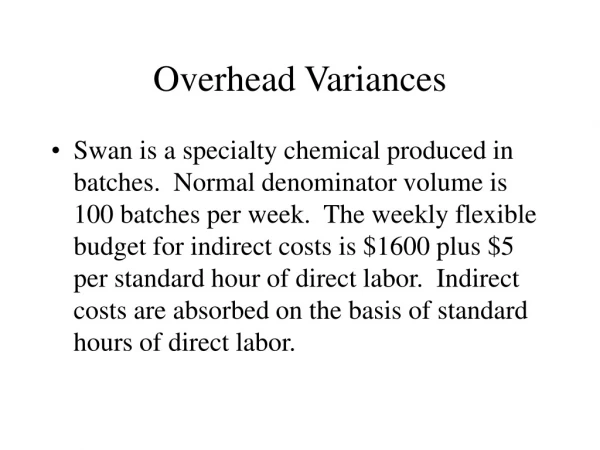
Variable OverheadCost Variances: in-class example Larry’s Machine Shop uses machine hours as the base to allocate VMOH. Larry budgeted output of 10,000 units using 7,500 machine hours. Budgeted VMOH cost per unit of output is $15. Actual output was 12,000 units, actual machine hours used were 11,000 hours, and actual VOH rate was $16 per unit of output. Calculate the: Static Budget, Sales-volume, Flex., Spending (price), and Efficiency (usage) variances.
VOH Efficiency Variance The efficiency variance that we calculated for direct inputs relates to how efficient we used the direct input (materials, labor). The VOH efficiency variance addresses how efficient the cost allocation base was used. If you want to calculate the spending or usage variance of any specific item in the cost pool, then you have to take it out of the OH pool and trace it directly.
FOH Variances: calculation ActualBudgetAllocated* Actual $FOH Lump sum For actual output: BQ of Alloc.base X BR / unit Alloc.base |-------- Spending -------|-------- Production Volume -------| |------------- Over or under-allocated FMOH -------------| * Standard costing is assumed.
Fixed Overhead Variances • There is no: • “flexing” of FMOH. • sales-volume variance • efficiency variance • The spending variance is also called: • Static-budget variance • Flexible-budget variance
Flexible-Budget Variance Actual Costs Incurred $300,000 Flexible Budget: Budgeted Fixed Overhead $286,000 – $14,000 U Fixed overhead spending variance (Fixed overhead flexible-budget variance)
Production-Volume Variance Flexible Budget: Budgeted Fixed Overhead $286,000 Fixed Overhead Allocated Using Budgeted Input Allowed for Actual Output Units Produced $220,000 – $66,000 U Production-volume variance 10,000 × 2.00 × $11 = $220,000
Fixed Overhead Variances Fixed overhead variance $80,000 U* P. Volume variance $66,000 U Spending variance $14,000 U * FOH was under-allocated by $80,000
Production-Volume Variance: Interpretation Management may have maintained some extra capacity. Production volume variance focuses only on costs. This variance results from “unitizing” fixed costs. ** Not much economic meaning to the production-volume variance.**
Interpreting the Production-Volume Variance Had Pasadena manufactured 13,000 suits instead of 10,000, allocated fixed overhead would have been = $286,000 (13,000 × 2.00 × $11). No production-volume variance would have occurred.
4-, 3-, 2-, and 1-MOH variance analysis. It is an issue of the level of aggregation desired. Most organizations use 3- or 2-variance analysis for MOH.
Integrated OH Analysis Variances: SpendingEfficiencyProduction-volume 4-variance analysis presents the most detail: VMOH $4,300 U $220 F Never FMOH $1,340 F Never $700 F 3-variance analysis: Total MOH $2,960 U $220 F $700 F 2-variance analysis: Flexible-budgetProduction-volume Total MOH $2,740 U $700 F 1-variance analysis: Total OH Variance Total MOH $2,040 U
VMOH-allocated $240,000 VMOH-efficiency Var. 18,000 VMOH-control $244,775 VMOH-spending Var. 13,225 (To isolate variances for the accounting period) Which are favorable (debit or credit entries)? Journal Entries for Overhead Costs and Variances
Financial and Nonfinancial Performance—Balanced Score Card Overhead variances are examples of financial performance measures. What are examples of nonfinancial measures? Actual labor time, relative to budgeted time Actual indirect materials usage per labor-hour, relative to budgeted indirect materials usage