
Exploring the Relationship Between Land Use, Cover, and Ecosystem Services in the U.S.
This study investigates the connection between Land Use and Land Cover (LULC) classifications and mapped ecosystem services. Findings indicate that open water areas provide more water provision and recreational opportunities, while woody wetlands are rich in habitat services. Developed land supports social interaction and cultural services. Additionally, grasslands have unexpected aesthetic opportunities despite being underrepresented in other services, and shrub/scrub areas excel in food provision. The results highlight the importance of considering ecosystem services in land management strategies.

Exploring the Relationship Between Land Use, Cover, and Ecosystem Services in the U.S.
E N D
Presentation Transcript
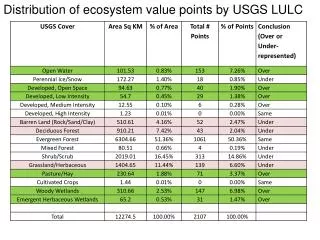
Is there a Relationship between Land Use and Land Cover (LULC) and mapped ecosystem services? ● open water land use classification has proportionately more water provision and recreation opportunity services than other classifications ● woody wetlands classification has proportionately more habitat services ● developed land use classifications have proportionately more social interaction and cultural opportunity services. ● although grassland/herbaceous is proportionately underrepresented in services by area, it has significantly more aesthetic opportunities than would be expected by land use classification. ● shrub/scrub land classification has proportionately more food provision services and proportionately fewer habitat services indicating the competitive relationship between food and habitat services in at least some land cover types. ● of ecosystem services that were infrequently mapped: genetic materials may be associated with deciduous forest and pollination may be associated with emergent herbaceous wetlands. Ornaments are disproportionately associated with shrub/scrub and grasslands/herbaceous areas. Land Use and Land Cover (LULC) data consists of historical land use and land cover classification data based primarily on the manual interpretation of 1970's and 1980's aerial photography. There are 21 possible categories of cover type. LULC data is widely available for the conterminous U.S. and Hawaii, but coverage is not complete for all areas.
Conclusions ● The web-based PPGIS interface works reasonable well to collect ecosystem service data; results appear generally consistent with other more labor intensive methods involving face-to-face interviews (Raymond et al., 2008) ● Respondents do not reflect a representative cross-section of the public. They are more highly educated, are more knowledgeable about nature and science, and have a stronger connection to the outdoors. Closer to “expert” GIS than “public” GIS. ● Some USGS land use/land cover classifications are disproportionately associated with ecosystem services (e.g., wetlands associated with habitat, forests associated with genetic materials) , but the real benefit would come from associations with less commonly mapped ecosystem services . Spatial data is insufficient in this pilot study ● Changing the PPGIS methodology to limit the number of markers per respondent to assure mapping process equity and reduce potential for bias would be counter-productive. Respondents will not representative and the opportunity to collect additional valid, place-based information will be lost
Data Viewer http://www.landscapemap2.org/ecoservices/data_viewer.php


