Download

1 / 35
350 likes | 525 Views
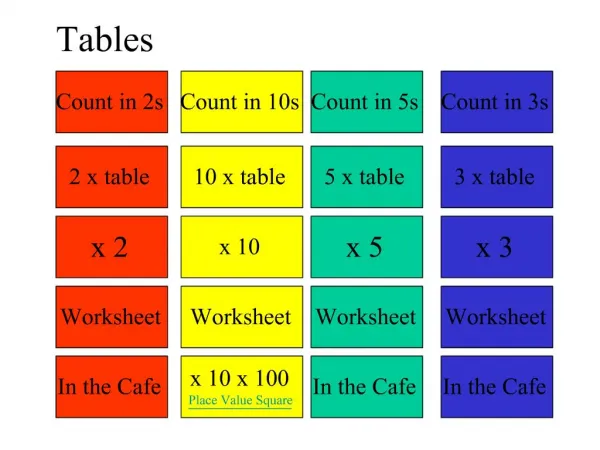
Advanced Tables. Lesson 9. Objectives. Creating a Custom Table. When a table template doesn’t suit your needs, you can create a custom table in Design view. In Design view, you can insert fields, set data types, and perform other advanced table design tasks.

E N D
Advanced Tables Lesson 9
Creating a Custom Table • When a table template doesn’t suit your needs, you can create a custom table in Design view. In Design view, you can insert fields, set data types, and perform other advanced table design tasks. • Creating a table from scratch in Design view gives you maximum flexibility. You can do everything you need to do to create the table in Design view, including adding fields, setting data types, defining field properties, and defining a primary key. As you create a table, you can also easily insert and delete rows in your table design. • In this exercise, you create a new blank table and then add fields for the new table in Design view.
Creating a Custom Table • Creating a new field for a table in Design view includes keying the name in the Field Name column; choosing a data type from the menu in the Data Type column; and keying a description, if you want, in the Description column. Additionally, you can modify field properties in the Field Properties section of the design grid. • After you have completed your table design, you’ll need to save it. If you haven’t already defined a primary key, Access will prompt you to do so when you save the table.
Step-by-Step: Create a Custom Table in Design View • Before you begin these steps, be sure to turn on and/or log on to your computer and LAUNCH Access. • OPENLucerne Publishing from the data files for this lesson. • SAVEthe database as Lucerne PublishingXXX (where XXX is your initials). • On the Create tab, in the Tables group, click the Table Designbutton. A new blank table is created in Design view, as shown at right.
Step-by-Step: Create a Custom Table in Design View • Key ID in the Field Name column, as shown above. • Press the Tab key to move to the Data Type column. • Click the down arrow in the Data Type column and select AutoNumber from the menu, as shown on the next slide. The AutoNumber data type will automatically number your records starting at 1.
Step-by-Step: Create a Custom Table in Design View • Press the Tab key to move to the Description field.
Step-by-Step: Create a Custom Table in Design View • Key Record Number and press Tab again to move to the next blank field row. • Key Gross Sales and press the Tab key. • Click the down arrow on the Data Type column and select Currency from the menu. • Click in the Decimal Placesrow in the Field Properties section. Click the down arrow and select 0 from the menu, as shown at right.
Step-by-Step: Create a Custom Table in Design View • Enter the remaining fields, as shown above, formatting each with the Currencydata type and 0 decimal places. • Click the row selector to the left of the ID field to select the row. • On the Designtab, in the Tools group, click the Primary Key button. • Click the Save button on the Quick Access Toolbar. The Save As dialog box appears. • Key Sales and click OK. • LEAVE the database open to use in the next exercise.
Inserting and Deleting Rows • When creating a custom table in Design View, you can insert and delete rows as needed using the Insert Rows and Delete Rows commands in the Tools group on the Table Tools Design contextual tab. When you click the Insert Rows button, a new row is inserted above the selected row. The field order from top to bottom in Design view will be displayed from left to right in Datasheet view. In this exercise, you insert and delete rows using the new table you created in the previous exercise.
Step-by-Step: Insert and Delete Rows in Design View • USEthe database open from the previous exercise. • Click the row selector to the left of the Gross Sales field to select the entire row. • In the Toolsgroup on the Table Tools Design contextual tab, click the Delete Rows button. The field row is deleted from the table. • Click the Undo button on the Quick Access Toolbar. The field row reappears. • In the Tools group on the Table Tools Design contextual tab, click the Insert Rows button. A blank row is inserted above the Gross Sales field. • In the Field Name column, key Area and press the Tab key.
Step-by-Step: Insert and Delete Rows in Design View • Press the Tab key again to accept the Text data type. • Leave the Description field blank and press Tab again to move to the next field. • Click the Savebutton on the Quick Access Toolbar. • Switch to Datasheet view and enter the records in the table as shown above. The ID field will be automatically generated, so just press Tab to get past it. • Save and close the table. • LEAVE the database open to use in the next exercise.
Using the Table Analyzer • The Table Analyzer is a wizard that performs the normalization process for you by examining a table design and suggesting a way to divide the table for maximum efficiency. The Table Analyzer helps you design efficient tables. The Table Analyzer will suggest primary keys for the new tables or will allow you to determine the primary keys. You can also have the wizard insert a unique identifier field. If it determines that a table has duplicate information, it can split a table into two more efficient tables for you, or you can choose to do it yourself. You can create the new tables yourself if you prefer.
Using the Table Analyzer • The Table Analyzer is a wizard that examines a table and asks you a series of questions about the table to determine whether it should be divided into two or more tables. In this exercise, you use the Table Analyzer Wizard to analyze a table in the database. • Well-designed databases do not store data in more than one place. Redundant data storage takes more disk space and increases the likelihood for data entry errors. In Lesson 1, you were introduced to the concept of normalization, which is the process of applying rules to a database design to ensure that you have divided your data into the appropriate tables.
Using the Table Analyzer • In the Books table, contact information for authors has to be entered for each book the author wrote. The Table Analyzer Wizard will determine that a more efficient database would split the table into two tables—one with author contact information and one with book sales data. • In addition to analyzing the table, the Table Analyzer Wizard will also analyze the redundant data in a table and suggest corrections for records that should match. It will also give you the choice of whether to create a query, which is similar to the original table. Creating the query allows forms and reports that were created with the original table to continue to function properly. The original table may be renamed, but it will not be removed or altered.
Step-by-Step: Use the Table Analyzer • USEthe database open from the previous exercise. • Open the Books table. • Scroll through the table to become familiar with the fields in the table. • On the Database Tools tab, in the Analyze group, click the Analyze Tablebutton. The first Table Analyzer Wizard dialog box appears, as shown above. This first dialog box provides more information about the types of problems the wizard will find.
Step-by-Step: Use the Table Analyzer • Click the Next >button. The second Table Analyzer Wizard dialog box appears, as shown at right. This dialog box provides more information about what the wizard will do.
Step-by-Step: Use the Table Analyzer • Click the Next >button. The third Table Analyzer Wizard dialog box appears, as shown at right.
Step-by-Step: Use the Table Analyzer • The Books table should be selected in the list; if it is not, select it. Click the Next > button. The fourth Table Analyzer Wizard dialog box appears, as shown at right.
Step-by-Step: Use the Table Analyzer • The Yes, let the wizard decidebutton should beselected; if it is not, select it. Click the Next > button. The fifth Table Analyzer Wizard dialog boxappears, as shown at right.
Step-by-Step: Use the Table Analyzer • Scroll to the bottom of the Table2box and click the Year field to select it. Notice that the wizard has placed it in the wrong table. • Drag the selected field to the Table1box. Position the horizontal black line below the Book Title field and release the mouse button to place the Year field in its new location. • Click the Table1 name to select it. Click the Rename Table button. The Table Analyzer Wizard dialog box appears, as shown below.
Step-by-Step: Use the Table Analyzer • Key Book Sales and click OK. • Click the Table2 name and click the Rename Table button. The Table Analyzer Wizard dialog box appears. • Key Author Contact Information and click OK. • Scroll down to the bottom of the Book Sales table. Notice that the Lookup to Author Contact Information field was added. • Scroll through the Author Contact Information table. Notice that the Generated Unique ID field was added as a primary key. Click the Next > button. The sixth Table Analyzer Wizard dialog box appears, as shown on the next slide.
Step-by-Step: Use the Table Analyzer • Click the IDfieldin the Book Sales table to select it. Click the Set Unique Identifierbutton. A primary key is inserted.
Step-by-Step: Use the Table Analyzer • Click Next >. The seventh Table Analyzer Wizard dialog box appears, as shown at right. • Notice that the Table Analyzer Wizard has detected two similar records, one with an incorrectzip code and phone number. Click the down arrow in the first row of the Correction field and select Leave as is.This is the correct record.
Step-by-Step: Use the Table Analyzer • Click the down arrow on the second row of the Correction field and select the Tomiccor-rection from the menu, as shown at right, to replace the incorrect record.
Step-by-Step: Use the Table Analyzer • Click Next >. The final Table Analyzer Wizard dialog box appears, as shown in at right. • The Yes, create the queryoption button should be selected. Click the Finishbutton. • A message saying that the new query will be saved as Books_NEW appears. Click OK.
Step-by-Step: Use the Table Analyzer • If Access Help appears on your screen, close it. Your screen should look similar to the figure below. • Close all tables and queries. • LEAVE the database open to use in the next exercise.
Summarizing Table Data • It is often necessary to count or summarize data in a table, column by column. Tables that contain columns of sales figures or other numbers need to be summed, averaged, or counted to be more useful. The Totals row makes these tasks easy. • Much like the bottom row of a spreadsheet, the Totals row is a feature in Access 2010 that makes it easy to sum, average, or count the values in a datasheet column. You can also find maximum or minimum values and use statistical functions such as standard deviation and variance. In this exercise, you summarize table data by inserting a Totals row.
Summarizing Table Data • Aggregate functions are functions that calculate values across a range of data, such as in a column. You can use these functions in queries or in Visual Basic for Applications (VBA) code. Although you can still use those methods, the Totals row saves you time by allowing you to choose one of these functions from a menu, applying it instantly. The Totals row is a row inserted at the bottom of a table that provides a menu of functions for each column in the row.
Step-by-Step: Insert a Totals Row • USEthe database open from the previous exercise. • OPENthe Book Sales table. • On the Home tab, in the Records group, click the Totals button. The Totals row appears below the asterisk (*) row. • Click the down arrow in the Book Title column of the Totalsrow. Select Count from the menu, as shown on the next slide. The number of records in the column is counted, and the number 11 is displayed.
Step-by-Step: Insert a Totals Row • Click the down arrowin the Domestic Salescolumn of the Totals row and select Sumfrom the menu.
Step-by-Step: Insert a Totals Row • Click the down arrowin the International Salescolumn of the Totals row and select Sumfrom the menu. Your screen should look similar to the figure at right.
Step-by-Step: Insert a Totals Row • Save the table. • On the Hometab, in the Records group, click the Totals button. The Totals row is hidden. • On the Hometab, in the Records group, click the Totals button again. The Totals row reappears. • Save and close the table. • CLOSE Access. • The table on the next slide describes the aggregate functions available in the Totals row and the data types that they work with. • As shown in the table, some functions only work with certain data types. For example, you cannot sum a column of text, so that function would not be available for a column with the data type of text.