
Uploaded by
alayna
1 SLIDES
186 VIEWS
10LIKES
Pathological scores
DESCRIPTION
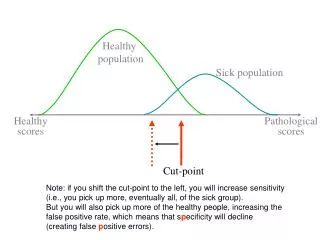
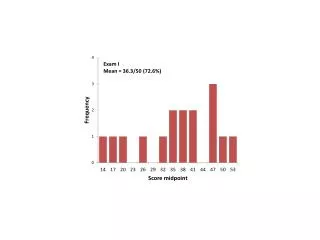
Healthy population. Sick population. Healthy scores. Pathological scores. Cut-point. Note: if you shift the cut-point to the left, you will increase sensitivity (i.e., you pick up more, eventually all, of the sick group).
Download
1 / 1
Download Presentation 
Pathological scores
An Image/Link below is provided (as is) to download presentation
Download Policy: Content on the Website is provided to you AS IS for your information and personal use and may not be sold / licensed / shared on other websites without getting consent from its author.
Content is provided to you AS IS for your information and personal use only.
Download presentation by click this link.
While downloading, if for some reason you are not able to download a presentation, the publisher may have deleted the file from their server.
During download, if you can't get a presentation, the file might be deleted by the publisher.
E N D
Presentation Transcript
Healthy population Sick population Healthyscores Pathologicalscores Cut-point Note: if you shift the cut-point to the left, you will increase sensitivity(i.e., you pick up more, eventually all, of the sick group). But you will also pick up more of the healthy people, increasing the false positive rate, which means that specificity will decline (creating false positive errors).


More Related
Audio
Live Player