HAL and little more
170 likes | 290 Views
This project delves into hydrometeorological research, focusing on the Arctic region's climate. It employs advanced models like MESH and integrates various data sources to study soil moisture, precipitation, and convective processes. Key partnerships with NASA, CSA, and Canadian universities enhance the validation of remote sensing tools. The initiative aims to improve hydrological prediction and water availability in arid regions, leveraging historical data and innovative methodologies. A significant outcome includes exploring lightning correlations to enhance rainfall predictions in data-sparse areas.

HAL and little more
E N D
Presentation Transcript
Hydrometeorology and Arctic Lab • Hydrometeorology • Instrumented Study area • MESH model • Some board participation • Convective Initiation (UNSTABLE) • Convective guidance • Arctic (and Climate) • Mainly using climate data for studies • Lightning correlations • Fog/ Stratus • Numerical model evaluation • DRI
H is for Hydrology • R&D of tools supporting hydrological prediction • water availability in arid regions • modeling and remote sensing tools • assess soil moisture in context of hydrological cycle. • Satellite validation • partnerships in campaigns during 2007, 2008, 2009 • A significant collaborative effort with NASA, CSA, AAFC, USDA, U of Guelph, U of Sherbrooke occurred in 2010 • Additional partnerships with University of Sask’s Global Institute for Water Security and Ag Canada’s NAIS program in 2011 • Achieved status as a NASA SMAP (Soil Moisture Active Passive) validation site in 2012
Integration of field studies forremote sensing and modeling validationHAL study site – Kenaston/Brightwater Creek • 24 sites (EC) • 10 x 10 km grid 24 EC precip, soil moisture stations Hourly precip and soil moisture at 3 depths • Nested scale design • 24 EC sites • 16 U of G sites • In the headwaters of Brightwater Creek (05HG002) • Suitable for modeling • and remote sensing • validation at multiple • scales
Collaboration – CanEx-SM10 SMOS validation SMAP pre-launch algorithm development BERMS Partners EC, NASA, AAFC, CSA, U of Guelph, U of Sherbrooke Kenaston 40 times series sites+ 20 additional ground truth sites BERMS 20 time series sites + temporary time series sites + additional ground truth sites
H is for Hydrological prediction • Exploring flow guidance system • Based on NWP • Polling provinces for interest and scope
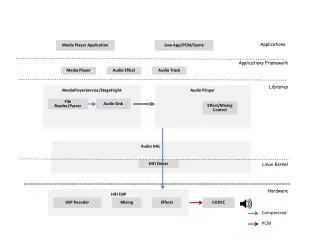
Background: The NWP System Upper air observations 4DVar data assimilation GEM atmospheric model CaPA: Canadian precipitation analysis “ “ On On - - line” line” “ “ Off Off - - line” line” mode mode mode mode Surface observations CLASS/ISBA WATFLOOD CaLDAS: Canadian land data assimilation CRHM Cold Regions Hydrological Model
Refined Proposal The task force to explore opportunities for better collaboration between EC and P/T Flood Forecasting agencies in the following ways: Develop a requirements document for EC to use as a basis for improving products and services to P/Ts Produce a discussion document regarding how P/Ts can help EC improve its Numerical Weather Prediction (NWP) model. Help write a 2013 Search and Rescue – New Initiatives Fund (SAR-NIF) proposal for additional funding. Encourage the prototyping and implementation of products and services to improve collaboration between P/T flood forecasters and EC.
D is between H and A:Drought Research Initiative – Prairie Extremes • A joint University-EC collaboration (UManitoba, USask, HAL, S+T) • Funded by CFCAS • To better understand the processes associated with the precipitation extremes (both wet and dry) and impacts across the Canadian Prairies that occurred in 2009-2011. Variety of Datasets Used • Gridded temperature and precipitation data sets (CANGRD, CAPA). • NCEP-NCAR reanalysis products. • Several surface-based data sources maintained by Environment Canada used to examine temperature and precipitation variations, lightning activity and river discharges. • Canadian National Fire Database used to characterize lightning-caused fire and associated area burned statistics
Moisture extremes and impacts occurring simultaneously over different parts of the region 2010 Gridded Total Precipitation from CAPA Large Fires (> 200 ha) on the Prairies 2009 - 2011
Surface rainfall and cloud-to-ground lightning relationships in Canada Exploratory Study: Can a predictive capability to estimate convective rainfall using lightning information be developed? Objectives: • Develop relationship between lightning activity and surface rainfall in Canada [rainfall yield] for period April-October 1999-2003. • Assess how well the derived rain yields can predict convective precipitation in Canada for the April-October seasons of 2004 and 2010.
Surface rainfall and cloud-to-ground lightning relationships in Canada Spatial pattern of rainfall yields across Canada’s ecozones for the period Apr-Oct 1999-2003 (units : x108 kg fl-1 [kg per flash])
Surface rainfall and cloud-to-ground lightning relationships in Canada • A broad swath of the middle and northern portions of Canada lie outside of radar coverage. • Examined the effect of replacing station-derived rain yields with ecozone-derived rain yields. • Prediction uncertainty error = ratio of ecozone MAE to observed precipitation (percentage) • A predictive capability to estimate seasonal convective rainfall using lightning information may be feasible in data sparse regions without radar coverage, but the predictions exhibit greater uncertainty in some ecozones than in others.