Performance Analysis and Tuning
220 likes | 658 Views
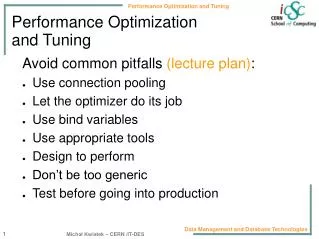
Performance Analysis and Tuning. Presented by Carol Thornborrow. System Performance. User “perceived performance”. System performance is the efficiency which system resources respond to current demands on the system.

Performance Analysis and Tuning
E N D
Presentation Transcript
Performance Analysis and Tuning • Presented by Carol Thornborrow
System Performance • User “perceived performance”
System performance is the efficiency which system resources respond to current demands on the system. Service Level Agreement (SLA) - Agreement between management, the user community and the information technology staff. System Performance
System Performance • What is “normal”? • Create a baseline for comparison.
Monitoring • Resources which affect system performance • CPU • Memory • Disk I/O • Network I/O • Resources affect on system performance • Not enough of the resource • Allocation of the resource is being mismanaged
Monitoring • Identifying bottlenecks • What is the problem? • Identify the Cause • What will it take to fix? • Is the problem fixed? • Reevaluate, start over • Monitoring Tools • OS utilities • vmstat, netstat • Vendor products • GlancePlus, SarCheck
Monitoring - CPU • Overall utilization • vmstat on most systems • sar –u Solaris and HP-UX • Load Average • uptime • Per process CPU time • ps –elf on HP-UX, Solaris • ps –aux on Red Hat, Free BSD • top - real time • pstree • init-+-alarmd |-7*[kdeinit]
vmstat 5 4 procs cpu r b w us sy id 1 0 0 3 5 92 0 0 0 0 1 99 0 0 0 0 1 99 0 0 0 2 0 98 r > 3-6/CPU us + sy > 80% sar –u 5 4 %usr %sys %wio %idle 0 0 0 100 0 1 1 98 0 0 0 100 0 0 0 100 Average 0 0 0 99 Monitoring - CPU
Tuning - CPU • Manually change priority • System V, Free BSD • renice new nice# pid • Solaris also has • priocntl –s –p new-pri –i pid proc-id • Replace CPU • Add CPU • Redistribute load • At – run process at specific time • Batch – run processes sequentially • Idle CPU
Monitoring - Memory • Active virtual memory • Solaris swap –l or sar -r • HP-UX swapinfo • Free BSD pstat -s • Red Hat swapon –s • Paging rate • vmstat • # of running processes • vmstat • Swaps • vmstat
Monitoring - Memory • vmstat 5 4 r w swap free re po 0 0 509552 38512 7 0 0 0 445184 35600 0 0 0 0 445184 35600 0 0 0 0 445184 35600 0 0 • sar –r 5 4 16:03:06 freemem freeswap 16:03:11 4413 888080 16:03:16 4409 888080 16:03:21 4409 888080 16:03:26 4409 888080
Tuning – Memory • Add more memory • Distribute swap space • Distribute jobs – at, batch • Virtual memory and paging • Free BSD sysctl • Increase vm.v_cache_min and/or vm.v_cache_max to favor fs buffer cache over user processes
Avg size of transfers iostat dad0 kps tps 4 1 94 26 kps/tps = Kb/transfer % of disk utilization iostat –D ssd0 rps wps util 0 7 4.2 0 8 2.6 System V sar –d Need accounting turned on May affect performance Monitoring – Disk I/O
Tuning – Disk I/O • Spread active files over several disks and controllers • Sequential files are contiguous and near outer edge of disk • Place randomly accessed files near center of disk • Place root system on own disk if possible • Disk striping • Purchase fast disks w fast controllers
netstat –i Collisions > 5% of total calls ping nfsstat –c retrans > 5% of calls badxid = retrans -> server badxid < retrans -> network Spread the network load between servers Add more bandwidth Monitoring and Tuning Network I/O