Download
1 / 12
120 likes | 206 Views
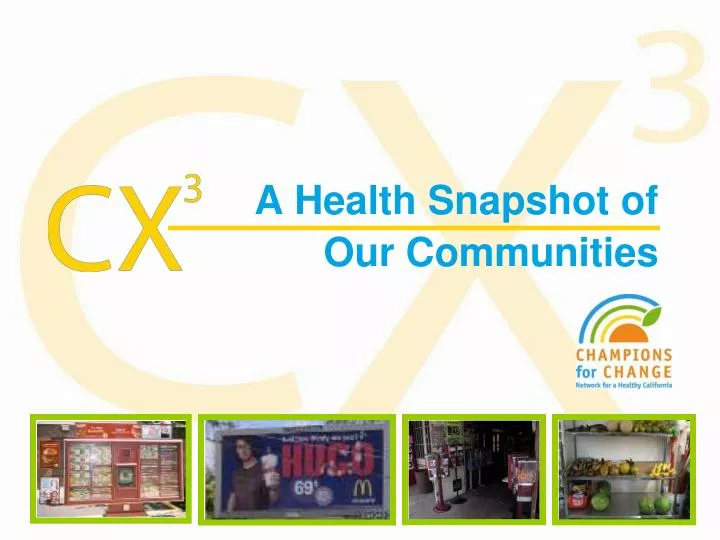
A Health Snapshot of Our Communities. Our Neighborhoods! All Neighborhoods Qualify at 130% FPL for All Races Franklin Middle/Lincoln Elementary 06037576401 (90813) and BG 060375765011 (90802) 1 st , 2 nd , and 6 th Districts 07-08 Fit Test* Results: Franklin - 31.3% 7 th graders

E N D
Our Neighborhoods! All Neighborhoods Qualify at 130% FPL for All Races Franklin Middle/Lincoln Elementary 06037576401 (90813) and BG 060375765011 (90802) 1st, 2nd , and 6th Districts 07-08 Fit Test* Results: Franklin - 31.3% 7th graders Lincoln – 80.5% 5th graders St. Mary’s 06037576300 (90813) 1st and 6th Districts 07-08 Fit Test* Results: Renaissance – 50.9% 9th graders International – 60.4% 5th graders New City – no data for 07-08 Washington School/S. Wrigley 06037575401 and 06037575402 (90813) 1st District 07-08 Fit Test* Results – 64.9% 7th graders Poly High 06037575300, BG 06037575201, and ½ BG 06037572013 (90813) 1st and 6th Districts 07-08 Fit Test * Results: Poly High – 63.6% 9th graders Roosevelt – 75.4% 5th graders Mary Butler/Central Long Beach 06037573300 (90806) 6th District 07-08 Fit Test* Results: 83.3% 5th graders/59.1% 7th graders *Fit Test = Aerobic Capacity Area Results Healthy Active Long Beach Communities of Excellence in Nutrition, Physical Activity and Obesity Prevention (CX3) FY 2008 – 2009
Key Neighborhood Findings • Limited access to affordable, healthy foods! • Stores and Fast Food Outlets in our neighborhoods do not meet standards for health. • In our neighborhoods, you will often pay more for fruit and vegetables compared to the county average. • Most stores selling alcohol do not comply with the State signage law (Lee’s law) • Most neighborhoods are lacking safe places for play • Areas around schools have high concentration of unhealthy food choices
Opportunities for Change! • With just a few simple changes many stores we surveyed could raise their scores to meet the standards for a “healthy market!” • Working with local markets to improve reduce marketing of unhealthy products on their doors and windows would improve safety while reducing unhealthy cues for action! • Community gardens could provide opportunities for physical activity and healthy food access
General Plan Update • Transportation Master Plan • Weed and Seed • City Council • Neighborhood Associations • Community Collaborative Groups • California Endowment: Building Healthy Communities
Healthy Active Long Beach City of Long Beach Department of Health and Human Services 2525 Grand Ave Long Beach, CA 90815 562-570-4294 Lara.turnbull@longbeach.gov