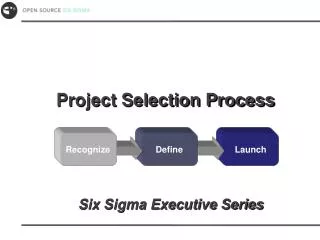
Project Selection
E N D
Presentation Transcript
I. Project Selection: Non-Numeric Models • Sacred Cow • Operating Necessity • Competitive Necessity • Product Line Extension • Comparative Benefit (E.g. Q-SORT: Projects are Divided into Rated Groups. If a Group Has More than Eight Members, It is Divided into Two Groups. Then Projects within Groups are Ranked).
II. Project Selection: Numeric Models • Payback Period Initial Fixed Investment / Annual Cash Inflow E.g. $10,000 / $2000 = 5 Years • Mean Rate of Return Annual Return / Initial Investment E.g. $3,000 / $10,000 = 0.30
II. Project Selection: Numeric Models • Present Value (Discounted Cash Flow) 1. In One Year: (Net Present Value)(1+k) = (Future Value) Where k is Interest Rate E.g. ($10,000 or NPV) (1.1) = $11,000 = F 2. In t Years: NPV (1+k)t = F E.g. ($10,000) (1.1) (1.1) = $12,100
II. Project Selection: Numeric Models • Present Value (Discounted Cash Flow) 3. Solving for NPV: NPV = F / (1+k)t E.g. NPV = $12,100 / 1.21 = $10,000 4. If You Have F’s in Different Years (or Periods) NPV = -A0 + [F1/(1+k)1] + [F2/(1+k)2] + Etc. NPV = -$7,000+($5,000/1.1)+($5,000/1.21) NPV = $1,677.68
II. Project Selection: Numeric Models • Profitability Index (Cost-Benefit) Index = NPV / Initial Investment (A0) E.g. Index = $1,677.68 / $7000.00 = 0.24
II. Project Selection: Numeric Models • Scoring Methods 1. Unweighted 0-1 Factor 2. Unweighted Factor Scoring Example – Project A Qualify No Qualify S Environmental Impact x 8 Need for Consultants x 3 Impact on Image x 7 Totals 2 1 18
II. Project Selection: Numeric Models • Scoring Methods 3. Weighted Factor Scoring For Each Project i: Si = Si1W1 + Si2W2 + Si3W3 + Etc. E.g. S1 = (10)(0.5) + (10)(0.3) + (5)(0.2) = 9 Select Projects with Highest Scores (Si’s)
II. Project Selection: Numeric Models • Scoring Methods 4. Linear (Integer) Programming Maximize Z = S1X1 + S2X2 + S3X3 + Etc. Subject to: m1X1 + m2X2+ Etc. M Xi = 0 or 1 E.g. Max. Z = 10 X1 + 10X2 + 5X3 s.t. 2X1 + 5X2+ 3X3 7 Workers X1,X2,X3 = 0 or 1
II. Project Selection: Numeric Models • Analysis of Projects Under Uncertainty • Primary Source of Uncertainty: Time and Cost • We Can Use Monte Carlo Simulation • Computer Can Generate Typical (E.g. Normally Distributed) Activity Times and Costs. After 1000’s of Runs a Cost Probability Distribution Can be Generated for Each Proposed Project. Probability Cost.3 $1000 .4 2000 .3 3000
Summary Numeric Methods Can Assist in: • Project Selection • Bidding through Cost Estimation and ComputerSoftware Such as Quickest (Constructive Computing)