Download
1 / 27
270 likes | 387 Views
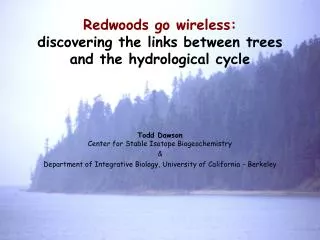
Redwoods go wireless: discovering the links between trees and the hydrological cycle. Todd Dawson Center for Stable Isotope Biogeochemistry & Department of Integrative Biology, University of California - Berkeley. Global Context:. • Forests cover 32% of the Earth’s surface

E N D
Redwoods go wireless:discovering the links between treesand the hydrological cycle Todd DawsonCenter for Stable Isotope Biogeochemistry & Department of Integrative Biology, University of California - Berkeley
Global Context: • Forests cover 32% of the Earth’s surface • Forests recycle ~66% of all the fresh water on Earth each year (~7,500,000 km3 moves through trees each year) • The “climate” system has long been thought to ‘drive’ this water movement through forests BUT . . . • Trees and forests significantly modify the climate and micro- climates that are known to drive water loss • There is a pressing need to determine the relative importance of biological & physical drivers of the hydrological cycle via, » Precise characterizations of the biological activities of trees » Precise characterizations of the environmental drivers
Local Context: • Coast redwood occupy a unique hydrological zone near the land-sea interface are characterized by: • Maritime Fog What is unknown is its importance for: (a) redwood tree ecology and physiology, (b) the water balance of redwood forests, (c) California’s water resource issues • Fog, and its importance in coastal California’s hydrology is unknown, yet could be central to understanding what links ocean and land systems and impacts coastal ecology. • In other coastal zones (Chile, W. Africa) fog is part of water resource management and conservation issues.
Redwood Program Objectives: • Elucidate the role of fog for/on: - The ecophysiology of redwood trees - The functioning of redwood forests with a focus on marine subsides of water • Place such an understanding into the broader view of how TREES shape the hydrological cycle and in particular the hydrology of California’s water limited environs
Influenced by Maritime Fog in Summer Present-day Coast Redwood Geographical Distribution Berkeley/SF
PAST APPROACH: Deployment of gear is done by us (read: Homo sapiens) » Sensors are all “wired” and therefore can only sample a very small fraction of what we need to sample
But…how do you determine the role of redwood trees in the hydrological cycle when canopy heights exceed 100m and environmental variation is perhaps the greatest we’ll ever find? THINK WIRELESS!
intel wireless sensor networks 2002 Weather mote Redwoods go wireless! Weather mote Burrow mote
Bottom Top 10m 20m 34m 30m 36m 2003, unpublished
What’s next? • Gather data in 3-D - play the movie • Render data and place trees into context • Model the plant-environment system • Compare to other systems Z Y X
Now MATCH with other Field Methods: • TREE-SCALE: Sap flow sensors (heat ratio method) placed in the lower stem, upper stem (50+ m) and upper branches of a 60-110 m redwood tree in coastal California • Ecosystem methods that permit us to characterize site water balance
A time of tremendous biological activity Typical Pattern of Rainfall and Fog Occurrence in Coastal California Dawson, 1998
Remove Trees and Fog inputs decline by 33 to 50% 465mm Total = 1,845mm Dawson, 1998
Heat Ratio SapflowMethod (Burgess et al. 2001) Probe set Solar power Well-organized multiplexer & wiring set-up Data logger, storage module & battery in tree
T1 Heater T2 Heat Ratio Method Because of its symmetric configuration, the HRM can resolve zero flows as well as reverse flows! Zero sap flow
T1 Heater T2 Heat Ratio Method Flow velocity (V) is logarithmically related to the ratio of temperature increases up- and down-stream from a heater Active sap flow V = thermal diffusivity x LnT1 probe distance T2 Active sap flow
Nighttime Transpiration [10-40% of day] Low Humidity Night
No transpiration Reverse flow [in daytime too] 5-7% of daily max High RH Wet leaves
-23.00 2 y = 0.0035x - 0.13x - 28.16 -24.00 2 R = 0.91 2 y = 0.0025x - 0.11x - 28.18 -25.00 2 R = 0.90 -26.00 2 y = 0.0038x - 0.28x - 23.60 C 2 R = 0.95 -27.00 13 d -28.00 -29.00 Sonoma Edge Sonoma Interior -30.00 Big Basin -31.00 Sonoma Edge 290.00 Sonoma Interior Big Basin 270.00 250.00 ) -1 2 y = -0.06x + 4.46x + 177.98 230.00 (ml l 2 R = 0.95 i C 210.00 2 y = -0.04x + 1.76x + 250.72 190.00 2 R = 0.90 170.00 2 y = -0.06x + 2.12x + 250.46 2 R = 0.91 150.00 0.00 10.00 20.00 30.00 40.00 50.00 60.00 70.00 80.00 Height (m) d13C (‰) Ci (ppm) Plant or environment?
Ecosystem Scale How do oceanic subsidies of water shape stand water use? Can we use natural gradients to help us obtain comparative data? Can we elucidate the importance of various controls: the “donor”, the plant, the microbes? From: Gilliam 1962
For 2001: »Big Basin trees use more water than do trees in Sonoma (drier nights?) »Interior trees use more than edge trees (unless its very foggy; Aug + Sept) »Trees in winter use 30-75 L/day but in summer use 175-350 L/day 2001 FOG 10 8 Sapflow (m3 x 103 month-1) 6 4 2 J F M A M J J A S O N D
Inter-annual comparison: 2001 vs. 2002 Rain fall (mm) Fog drip (mm) VPDsummer (kPa) H2O use (L) 2001 2002 BB 2001 2002 SE 2001 2002 SI Tree water use and stand water balance is a function of: » Fog inputs and evaporative demand for summer water (supply vs. demand) » Water stress in summer (influences both supply and demand)
warm cool PDO & ENSO influence SST and in turn fog formation