Download
1 / 43
440 likes | 623 Views
The State of Food and Agriculture in Syria 2007. By Samir Grad AFD Division 1/7/2008. Contents. Chapter 1: Geography, Climate and Resources. Chapter 2: Agriculture in the National Economy. Chapter 3: Agricultural Inputs and Supporting Services.

E N D
The State of Food and Agriculture in Syria 2007 By Samir Grad AFD Division 1/7/2008
Contents • Chapter 1: Geography, Climate and Resources. • Chapter 2: Agriculture in the National Economy. • Chapter 3: Agricultural Inputs and Supporting Services. • Chapter 4: Agricultural Production. • Chapter 5: Selected Commodity Chains. • Chapter 6: Value Chain of Agricultural Production. • Chapter 7: Agro-Food Industry • Chapter 8: Food Security.
Objectives of the Report • Provide, comprehensive information of relevance to agricultural development : • Debating and enhancing agricultural plans and policies. • Offering an updated review of agricultural issues. • Present results of NAPC studies of relevance. • Supply and demand study of the AFD. • Every two years.
Some Features of this Edition • Development of the agricultural sector is analyzed during 1997-2006. • The focus is on the short/medium-term analysis of the period 2000-2006 to quantify the impact of various policies. • Investigates the period 1982-2005 to quantify the long-term effects of economic factors such as prices and income.
Some Features of this Edition • Descriptive statistical indicators are used to analyze agricultural phenomena. • Indicates national, Arab and international benchmarks to analyze agricultural performance. • National benchmarks are the orientations of the Syrian Agricultural Development Strategy (SADS) and the tenth Five Year Plan (FYP) for the period 2006-2010.
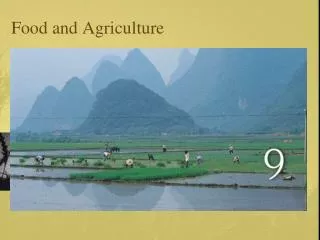
Chapter 1Geography, Climate and Resources • Geographic location and climatic condition. • Agricultural resources. • Natural resources comprising land, water, pastures, forestry and fishery. • Human resources. • Policies, legislations and regulations governing the agricultural resources.
Chapter 1Some Evidences • Agricultural resources have witnessed an overall positive development trend during 2000-2006. • Agricultural resources are becoming increasingly rare (land and water). • Adoption of sustainable resource use policies is seriously needed in agriculture.
Chapter 2Agriculture in the National Economy • Development of policies affecting agricultural performance. • Macro policies comprising monetary, fiscal and trade policies. • Agricultural policies. • Contribution of agriculture to gross output, GDP, employment, income, food security, industry, foreign trade and investment. • Contribution to GDP was 23-26% during 2000-2006. • Per capita GDP in constant prices of 2000 increased annually by 2.2% during 2000-2006. • Share in labor force amounted to 20% in 2006. • Share in foreign trade accounted for 16% during 2003-2005.
Chapter 2Positive Impact of Policies • Agricultural and macro policies in the context of reforming Syrian Economy and trade liberalization have contributed to ameliorating agricultural sector performance leading to an increase in its contribution to the national economy through: • Contribution to gross output and GDP; • Providing job opportunities and improving income; • Providing food needs and fostering food security; • Providing agro-industrial inputs; • Increasing contribution to total trade; • Improving investment environment and attracting investments in agricultural and agro-industrial fields.
Chapter 2Factors Constraining the Sector Performance • Scarcity of agricultural land resources and land fragmentation. • Shortage of water resources due to weather instability and drought. • Insufficiency of pastures and fodder for the livestock due to adverse climatic conditions. • Competition among economic activities on labor force. • Difficulties in adopting modern techniques. • Infrastructure constraints. • Marketing constraints. • Standards related constraints. • Administrative constraints.
Chapter 3Agricultural Inputs and Supporting Services • Policies related to agricultural inputs and supporting services. • Provision of agricultural inputs. • Supplying of agricultural supporting services.
Chapter 3Some Evidences • The government of Syria operates the following: • Provision of agricultural inputs in sufficient quantities and appropriate qualities. • Subsidization of inputs and introduction of modern techniques to improve performance. • Rationalization of input usage. • Easy access to inputs especially improved seeds and fertilizers. • Introduction of suitable solutions for the provision of agricultural inputs and their efficient use. • Enhancement of agricultural supporting services.
Chapters 4 and 5Agricultural Production and Selected Commodity Chains • Policies affecting the performance of agricultural production. • Food control, relevant rules & regulations, and commodity chain organization. • Taxes and subsidies of food products. • Composition of plant production and its development. • Livestock production and its development. • Forestry and fishery. • Selected commodity chains.
Chapters 4 and 5Some Evidences • Changes in agricultural production are reviewed and analyzed during 2000-2006 in light of SADS, 10th FYP, policies and international benchmarks. • They present the long-term impact of economic factors such as prices during 1982-2005. • Index numbers are used to analyze the development and impact of area, yield and other measures on agricultural production during 2000-2006. • Significant achievements have been made in the area of agricultural production. • Initiatives are required to boost performance.
Chapters 4 and 5Some Benchmarks • Increasing the annually cultivated area by 0.8%, while that of the rain-fed trees can be increased by 2.1% per year. • Enhancing the yield of the irrigated crops by 3-5% annually and that of the rain-fed crops by more than 1% during 2001-2005. These rates should reach 2% for irrigated and rain-fed crops, 1% for cotton and 2% for wheat during 2006-2010. • Improving red and white meat production by 5% per year and milk by 4% during 2001-2005. These rates have been modified for the period 2006-2010 to become 2.4% for red meat, 4.3% for white meat, and 5% for milk. • Increasing legumes and fodder crops in crop rotation. • Arab world: Cereals yield(1,690 kg/ha) , legumes yield (1,139 kg/ha), vegetables (18,539 kg/ha), fruit trees (6,596 kg/ha). • Wheat: Arab world(2,374 kg/ha), Russia (1.88 ton/ha), China (4.18 ton/ha), EU (5.9 ton/ha).
Chapters 4 and 5Index Numbers 2000-2006Impact of the Area and Yield on Production
Chapter 6Value Chain of Agricultural Production • Contents • Agricultural prices. • Value related to agricultural production and inputs. • Agricultural value added. • Indicators of agricultural performance. • The impacts of the factors underlying the value of agricultural production and its inputs are quantified. • Presents the price and income elasticities of selected food groups.
Chapter 6Indicators of Agricultural Performance, Constant (%)
Chapter 7Agro-Food Industry • Policies governing the sector and their development. • Overall development of the sector. • Development of the public sector. • Development of the private sector. • Development of the joint sector. • Foreign trade of processed food. • Investment and employment in the sector. • Selected agro-food sub-sectors.
Chapter 7Some Evidences • Characteristics of the public sector: • Old processing lines. • High production costs and low profitability. • Substantial lack of advertising and marketing activities. • Inflexibility of the decision making process due some legislations and laws. • Mobility of educated labor to private sector. • Weak competitiveness. • Reduction of market share.
Chapter 7Some Evidences • Characteristics of the private sector: • Active diversification strategy (size, form and attractiveness). • Active advertising and marketing policies. • High flexibility in meeting the market demand. • Steps of the government to encourage private investments: • Establishing an adequate data base, conducting studies and improving legislations and institutions. • Enhancing the agro-food industry in the context of trade liberalization (quality and standards of GAFTA and EU). • The share of the agro-food industry in the GO and NDP of the transformation industry amounted to 25% and 28% respectively averaging the period 1996-2006. • Improvement in the performance is observed during 1996-2006 (GO, NDP, exports and number of projects).
Chapter 8Food Security • Policies governing food security (Development and applied). • Availability of agricultural products (total and per capita). • Contribution of agricultural trade to food security (stability dimension). • Food consumption and acquisition. • Follow-up of the major results of the World Food Summit. • Programs supporting food security. • Indicators of food security.
Chapter 8Some Evidences • Substantial progress was achieved in the field of food security during 1996-2005 because of the increased availability of food for consumption, stability of food supply and improved access to food. • There are constraints in balancing the vegetal and animal sources to get the required nutrients intakes. • It is necessary to push the integration of the Syrian market with the Arab and European markets in order to improve efficiency.
Chapter 8Some Evidences • Self-sufficiency has been achieved in a variety of products. • Parallel with above, there is an attempt to enhance self-reliance in other important commodities (imported ones) according to the principle of economic efficiency. • There is an improvement in trade balance (import +export). • There is an improvement in nutrient (calorie and protein) intakes (excluding animal sources). • Improvement in the measures underlying food security.
Thank You For Your Attention