Human EKG
Human EKG. Heart: Review. Electrical Pathway of the Heart. SA Node. Bundle of His. AV Node. Left bundle branch. Right bundle branch. Purkinje fibers. Inferior vena cava. EKG or ECG. Electrocardiogram Willem Einthoven-1903


Human EKG
E N D
Presentation Transcript
Electrical Pathway of the Heart SA Node Bundle of His AV Node Left bundle branch Right bundle branch Purkinje fibers Inferior vena cava
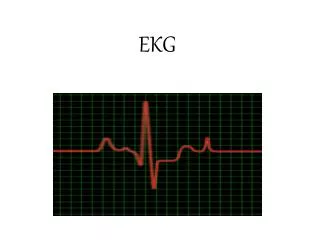
EKG or ECG • Electrocardiogram • Willem Einthoven-1903 • A record of the overall spread of electrical activity of the heart. • What EKG actually records: • NOT a direct recording of electrical activity. Recording a portion of electrical activity induced in body fluids by cardiac impulse that reaches the surface of the body. • NOT a recording of a single AP in a single cell at a single point in time. Represents the SUM of electrical activity in all of cardiac muscle cells. • Represents comparisons in voltage detected by electrodes at two different points on the body’s surface. Not actual potential.
Einthoven’s Triangle • Determines the electrical axis of the heart. • Equilateral triangle. The vertices are at the left and right shoulders and the pubic region. • The center corresponds to the vector sum of all electric activity occurring in the heart at any given moment. • Based on 3 lead system. Now have 12 lead systems that are much more accurate. • Einthoven’s law: At any instant the potential of any wave in lead II is equal to the sum of potentials in leads I and III.
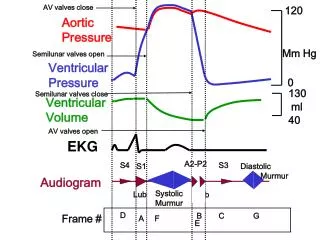
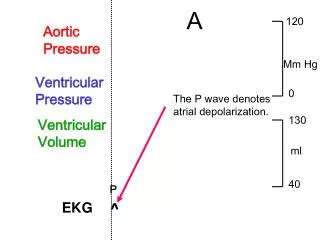
Ventricular Depolarization Ventricular Repolarization Atrial Depolarization Diastole 80 mmHg Systole 120 mmHg
Why Use EKG? • Detect Arrhythmias • Irregular heart beat • May indicate medical disorder or be due to physiological state. • Bradycardia = decrease heart rate (sinus node problem OR athlete) • Tachycardia = increase heart rate (imbalance of electrolytes OR exercise)
Today’s Lab • EKG and Heart sounds. • Only do lab on 2 group members. • Only have to do resting EKG once for each member (ignore Experiment 1 in heart sounds lab).
Homework!!!! • Answer all labscribe questions. • Write a results and methods section for this lab. Please attach a data sheet with all of your RAW data. • RAW data should not be a part of your results section!
Results Section • Should concisely present your data. This section should have figures and/or tables AS WELL AS a paragraph explaining those data. • Don’t interpret the data, however, you should point out any trends (i.e. heart rate increases with increased activity or average heart rate was lower in males than females).