Download

1 / 14
160 likes | 435 Views
Mann-Whitney and Wilcoxon Tests. Types of Inferential Statistics. Inferential Statistics : estimate the value of a population parameter from the characteristics of a sample Parametric Statistics :

E N D
Mann-Whitney and Wilcoxon Tests
Types of Inferential Statistics • Inferential Statistics:estimate the value of a population parameter from the characteristics of a sample • Parametric Statistics: • Assumes the values in a sample are normally distributed • Interval/Ratio level data required • Nonparametric Statistics: • No assumptions about the underlying distribution of the sample • Used when the data do not meet the assumption for a nonparametric test (ordinal and nominal data)
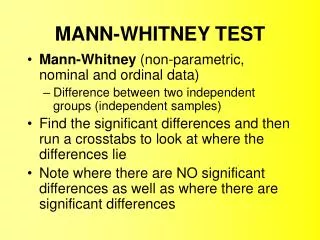
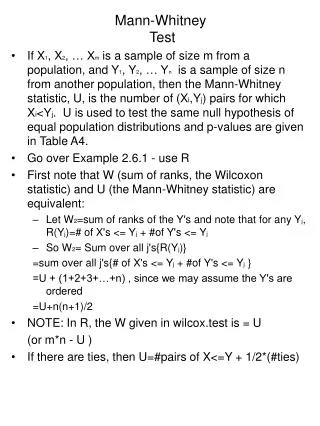
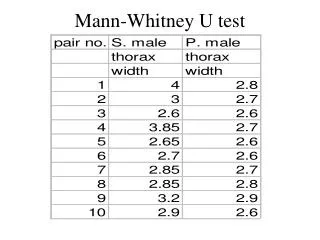
Mann Whitney U Test • Nonparametric equivalent of the independent t test • Two independent groups • Ordinal measurement of the DV • The sampling distribution of U is known and is used to test hypotheses in the same way as the t distribution. U
Mann Whitney U Test • To compute the Mann Whitney U: • Rank the scores in both groups (together) from highest to lowest. • Sum the ranks of the scores for each group. • The sum of ranks for each group are used to make the statistical comparison.
Non-Directional Hypotheses • Null Hypothesis: There is no difference in scores of the two groups (i.e. the sum of ranks for group 1 is no different than the sum of ranks for group 2). • Alternative Hypothesis: There is a difference between the scores of the two groups (i.e. the sum of ranks for group 1 is significantly different from the sum of ranks for group 2).
Computing the Mann Whitney U Using SPSS • Enter data into SPSS spreadsheet; two columns 1st column: groups; 2nd column: scores (ratings) • Analyze Nonparametric 2 Independent Samples • Select the independent variable and move it to the Grouping Variable box Click Define Groups Enter 1 for group 1 and 2 for group 2 • Select the dependent variable and move it to the Test Variable box Make sure Mann Whitney is selected Click OK
Interpreting the Output The output provides a z score equivalent of the Mann Whitney U statistic. It also gives significance levels for both a one-tailed and a two-tailed hypothesis.
Generating Descriptives for Both Groups • Analyze Descriptive Statistics Explore • Independent variable Factors box • Dependent variable Dependent box • Click Statistics Make sure Descriptives is checked Click OK
Wilcoxon Signed-Rank Test • Nonparametric equivalent of the dependent (paired-samples) t test • Two dependent groups (within design) • Ordinal level measurement of the DV. • The test statistic is T, and the sampling distribution is the T distribution. T
Wilcoxon Test • To compute the Wilcoxon T: • Determine the differences between scores. • Rank the absolute values of the differences. • Place the appropriate sign with the rank (each rank retains the positive or negative value of its corresponding difference) • T = the sum of the ranks with the less frequent sign
Non-Directional Hypotheses • Null Hypothesis: There is no difference in scores before and after an intervention (i.e. the sums of the positive and negative ranks will be similar). • Non-Directional Research Hypothesis: There is a difference in scores before and after an intervention (i.e. the sums of the positive and negative ranks will be different).
Computing the Wilcoxon Test Using SPSS • Enter data into SPSS spreadsheet; two columns 1st column: pretest scores; 2nd column: posttest scores • Analyze Nonparametric 2 Related Samples • Highlight both variables move to the Test Pair(s) List Click OK To Generate Descriptives: • Analyze Descriptive Statistics Explore • Both variables go in the Dependent box • Click Statistics Make sure Descriptives is checked Click OK
Interpreting the Output The T test statistic is the sum of the ranks with the less frequent sign. The output provides the equivalent z score for the test statistic. Two-Tailed significance is given.