Download
1 / 17
180 likes | 341 Views
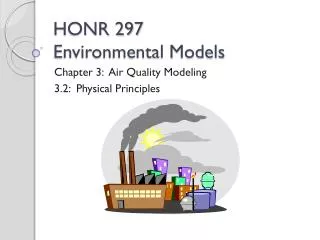
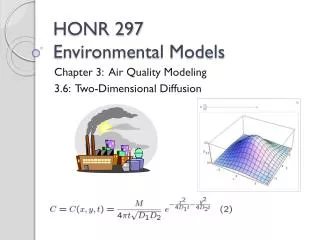
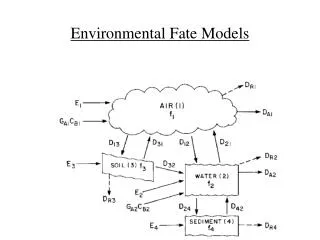
HONR 297 Environmental Models. Chapter 3: Air Quality Modeling 3.5: One-Dimensional Diffusion. Diffusion in a Long Tube. Suppose we inject a total mass M of dispersible material into an infinitely long tube at the point x = 0, at time t = 0.

E N D
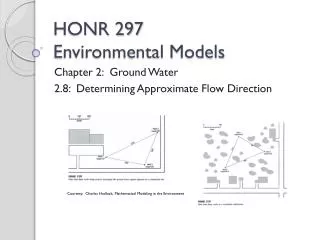
HONR 297Environmental Models Chapter 3: Air Quality Modeling 3.5: One-Dimensional Diffusion
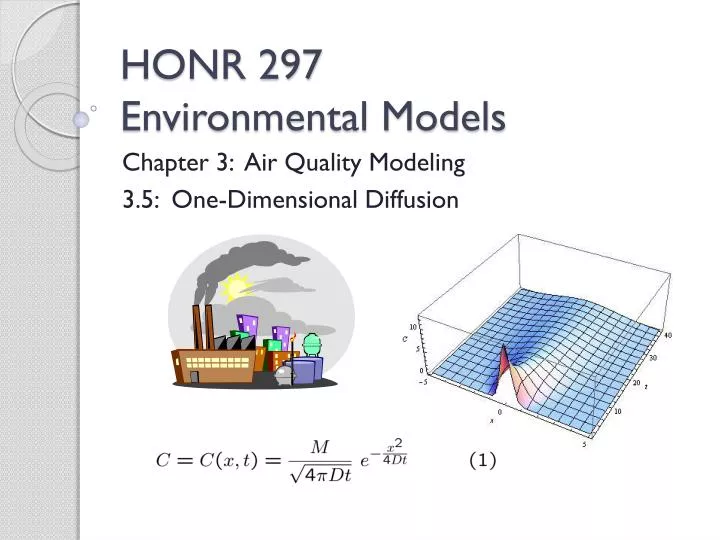
Diffusion in a Long Tube • Suppose we inject a total mass M of dispersible material into an infinitely long tube at the point x = 0, at time t = 0. Image Courtesy Charles Hadlock: Mathematical Modeling in the Environment
Diffusion in a Long Tube • Note that for this situation, we are assuming the tube is infinitely long to avoid the issue of modeling a tube with ends that are blocked off. • This works fine if the tube is very long relative to the distance scale used. • It also works well for outdoor air pollution problems!
Diffusion in a Long Tube • Question: • What will be the concentration of material at any point at any time after the moment of initial injection?
Expected Behavior … • Intuitively, what should we expect? • The material will diffuse to the left and right. • The center concentration will decrease. • The concentration at points farther away from the center will gradually increase – it will be higher closer to the center, at least in the beginning. • The concentration will eventually diffuse to zero.
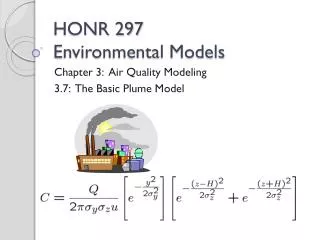
One-Dimensional Diffusion Equation • To quantify the above qualitative description of what will happen, we can use the following model equation. • Equation (1) is known as the one-dimensional diffusion equation!
One-Dimensional Diffusion Equation • In this equation, • C is the concentration of contaminant, with units [C] = mass/length or weight/length (for example gm/cm or lb/ft), since we are looking at one-dimensional diffusion! • M is the amount of material injected instantly into the center of the tube, with units [M] = mass or weight (for example gm or lb). • x is the position along the tube, with units [x] = length (for example meters or feet). • t is the time after the contaminant is initially released (release time is t = 0), with units [t] = time (for example seconds or hours).
One-Dimensional Diffusion Equation • Finally, • D is the diffusion coefficient, with units [D] = (length^2)/time (check that this makes sense in equation (1) dimensionally). • Example units might be (m^2)/sec or (ft^2)/hour. • D gives an indicator of how fast (or slow) the diffusing material moves through the substrate (underlying medium) in the tube.
One-Dimensional Diffusion Equation • Values for D depend both on the diffusing material and the substrate. • For example, think of perfume in air vs. sugar in water vs. ink in gel – which will have a higher diffusion coefficient? • In general, we will need to know D for a given situation to compute C!
Computing Concentration • Question: • If we know diffusion coefficient D, how can we evaluate the concentration C at any position x, at any time t > 0? • Answer: • Use equation (1) with a choice of x and t. • For example, if D = 0.05 (cm^2)/sec, M = 10 gm, what is C at x = 2 cm, when t = 5 sec?
Computing Concentration • Another Question: • Suppose we want to know the concentration at one hundred different points, for every minute, for one hour after initial release. Would this be “fun” to do by hand? • Answer: • NO! • In order to compute many values of C, it is better to use a computer program, such as Excel or Mathematica.
Concentration via Excel • Using Excel, for the example above, find concentration levels C at positions x = -5, -4, -3, -2, -1, 0, 1, 2, 3, 4, 5 cm and times t = 1, 10, 20, 30, 40, 50, 75, 100 sec. • Then plot the concentration at fixed time t = 10 sec and fixed position x = 2 cm. • How could we plot concentration as a function of both position and time? • One way is via Mathematica!
Resources • Charles Hadlock, Mathematical Modeling in the Environment – Chapter 3, Section 5