Download
1 / 19
190 likes | 299 Views
PS to SPS Transfer Studies. Elena Shaposhnikova , Helga Timkó , Theodoros Argyropoulos , Thomas Bohl, Heiko Damerau , Juan Esteban Müller BE-RF-BR. Outline. Earlier PS to SPS transfer studies Why we are still interested to continue Measurement and simulation Methods

E N D
PS to SPS Transfer Studies Elena Shaposhnikova, Helga Timkó, Theodoros Argyropoulos, Thomas Bohl, Heiko Damerau, Juan Esteban Müller BE-RF-BR
Outline • Earlier PS to SPS transfer studies • Why we are still interested to continue • Measurement and simulation • Methods • July ‘11 MD: bunch length and transmission as a function of emittance • November ‘11 MD: Tracking the bunch lengths in the PS during splitting and rotation • Conclusions and outlook SPSU-BD Meeting
PS TO SPS TRANSFER: PREVIOUS STUDIES
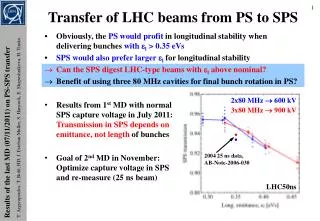
Motivation • Larger emittances in PS (and SPS) are preferable from the longitudinal stability and the delivered intensity point of view, but • Larger εl→ longer τ at ejection → more transfer losses • Bunch ‘gymnastics’ in the PS to SPS transfer: • Starting from (4+2)×3=18 bunches in PS, 10 MHz • Single or double splitting for a 50 ns (20 MHz) or 25 ns (40 MHz) bunch spacing, respectively • Non-adiabatic bunch rotation to shorten the bunch length • Injection to the 200 MHz SPS bucket
Capture losses, 2003/2004 CERN-AB-Note-2004-036 • Matched voltage at injection to SPS: 750 kV • Capture loss vs. capture voltage/intensity was studied • 72 bunches w/ 25 ns spacing, 3-4 batches • τ4σ = 4.2 ns, εl = 0.35 eVs at injection to the SPS • New voltage programme: 2-3 MV injection steps SPSU-BD Meeting
Transfer optimisation, 2008 CERN-AB-Note-2008-021 • Study of the bunch shaping in the PS: bunch rotation with 2 or 3 cavities, i.e. 600 or 900 kV, respectively • The idea behind: higher voltage → more stretched bunches → shorter τ after rotation → less beam losses (?) • Observed: no clear dependence on the rotation voltage • But: a strong dependence of beam loss on intensity Total losses SPSU-BD Meeting
Rotation voltage revisited, July 2011 • Systematic scan of losses vs. bunch length for 600 and 900 kV PS rotation voltage; 50 ns scenario • Transmission doesn’t improve Operational SPSU-BD Meeting
JULY 2011 MD DATA: Comparison with Simulations
Simulation methods (50 ns scenario) • Use the experimentally measured PS FB bunch distribution (sample 500,000 particles) and real PS & SPS voltage programme • STEP 1: Split the initial bunch SPSU-BD Meeting
Simulation methods cont’d (50 ns scenario) • STEP 2: iso-adiabatic bunch shortening • STEP 3: non-adiabatic bunch rotation • STEP 4: injection to SPS bucket N.B. bunch length at ejection is critical! SPSU-BD Meeting
Simulations vs. measurements • In principle, simulations apply the same bunch gymnastics as experiments • However, simulations do not take into account • Intensity • Impedance • Error sources such as synchronisation of RF phases between different harmonics etc. SPSU-BD Meeting
Results • Simulated τ’s are systematically lower, but same trend • Reproduces the earlier finding that higher SPS voltage is better SPSU-BD Meeting
Results cont’d • Introduce a blow-up in simulations to compare τ’sTransmission roughly comparable (N.B. simulation is ‘perfect’) SPSU-BD Meeting
Predicted effect of different voltage programmes • As seen in the ‘08 MD, losses are little affected by VSPS • What counts is ε at injection • εrms = 0.1 eVs (@ rot), • εrms = 0.14 eVs (@ inj) • εrms = 0.08 eVs (@ rot), • εrms = 0.1 eVs (@ inj) • εrms = 0.08 eVs (@ rot), • εrms = 0.09 eVs(@ inj) • εrms = 0.1 eVs (@ rot), • εrms = 0.14 eVs (@ inj) SPSU-BD Meeting
NOVEMBER 2011 MD DATA: TRACKING THE bunch Lengths
The evolution of bunch length in the PS • We then measured τ at different moments in the PS, while taking in parallel tomoscopy data of the initial FB bunch distribution • Losses in SPS (excl. acceler.): ~1.7 % (4.6e12), ~2.8 % (9.2e12) • N.B. very low!! SPSU-BD Meeting
Corresponding simulations • Systematically lower simulated bunch lengths, already from the very beginning SPSU-BD Meeting
Simulation vs. experiments • The ratio of the simulated/experimental bunch lengths shown in the previous table; the experimental emittance is blown-up SPSU-BD Meeting
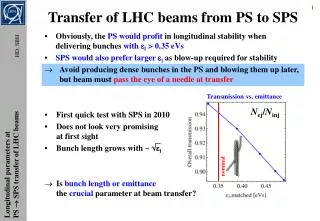
Conclusions and outlook • Transmission was improved over the years but is still an issue if emittance needs to be increased • Increasing the SPS voltage at injection can somewhat improve the transmission, however, • The key factor is the emittance at extraction • ESME simulations reproduce the experimentally observed trends • An emittance blow-up was observed in the PS already before the first splitting • Explanation for simulated bunch lengths being shorter • Work in progress: • Compare with recent MD on 25 ns-scenario transmission • Look for possible reasons of the emittance blow-up SPSU-BD Meeting