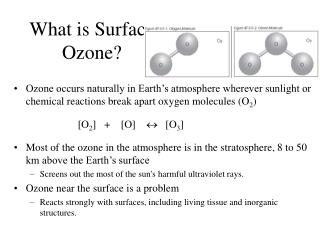
Download

1 / 16
160 likes | 268 Views
EAS 6792. Surface Ozone during Fall in the S outheastern U nited States. Yuzhong Zhang April 23, 2013. Why cares about ozone during fall?. Sept., Oct. June, Aug. Nolte et al., 2008. Chen et al., 2009. What interests us?. Southeast US October.

E N D
EAS 6792 Surface Ozone during Fall in the Southeastern United States Yuzhong Zhang April 23, 2013
Why cares about ozone during fall? Sept., Oct. June, Aug. Nolte et al., 2008 Chen et al., 2009
What interests us? • Southeast US • October What are the features of monitoring data in October? Mean, Trend, Variability, Distribution • Features • Factors • Simulation • Sensitivity What factors affect the October ozone in SE US? Meteorology, Emission Is a current 3D chemical transport model able to simulate October ozone? Day-to-day, Inter-annual Is the sensitivity of ground ozone in October different from that in summer months? Implications? ?
Features Distribution MDA8
Features Variance Var(all) = Var(Spatial) + Var(Inter-annual) + Var(Day-to-day)
Trend, variability, and extremes Features 0.11±0.16 ppbv/yr 2σ
IAV of O3 and meteorology Factors Inter-annual variability of ozone R = -0.80 R = -0.13 Ozone ppbv Oct. 2010
MDA8 O3 in Oct. 2010 and met. Factors Day-to-day variability of ozone R = 0.71 R = -0.58 Ozone ppbv
Modeled monthly mean Simulation Regional chEmicaltrAnsport Model (REAM) Oct., 2010 Monthly mean afternoon ozone Observation Model
Simulation Modeled day-to-day variation
Comparison with summer Sensitivity Oct. ozone has • Less effectiveness of NOx emission reduction • Stronger sensitivity to biogenic emission
Conclusions • No significant trend in last three decades • Increased inter-annual variability • Extremely high ozone year of 2000 and 2010 • Correlation between cloud fraction and monthly mean October ozone. Records show
Conclusions Model simulation shows • Capability to reproduce monthly mean • Less day-to-day variability than observations Model sensitivity analysis shows • Less benefit from NOx emission reduction • Greater impact of biogenic emission Climate change may play a bigger role in fall than in summer
Supplemental slides ΔO3 due to 20% reduction of NOx emission Fall Summer