Hydraulic Parameterization of 3D Subsurface Models: Linking Measurement and Model Scales
This study presents a comprehensive approach to parameterizing 3D subsurface groundwater models in the Netherlands, covering approximately 41,000 km². Utilizing ArcGIS and voxel models, we assess hydraulic conductivity by integrating systematic sampling and empirical relationships between lithology and grain size. This research defines a new procedure for assigning effective hydraulic conductivity values to voxels, accounting for scale differences and small-scale heterogeneities. Ultimately, we create a hydraulic resistance map essential for groundwater flow modeling and resource management.

Hydraulic Parameterization of 3D Subsurface Models: Linking Measurement and Model Scales
E N D
Presentation Transcript
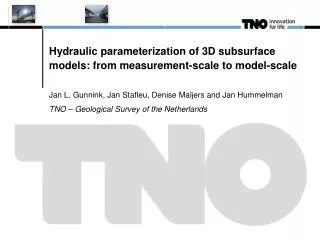
Hydraulic parameterization of 3D subsurface models: from measurement-scale to model-scaleJan L. Gunnink, Jan Stafleu, Denise Maljers and Jan HummelmanTNO – Geological Survey of the Netherlands
M Bouman TNO Nieuwehuisstijl Layer-based models nation-wide (~41,000 km2) upper 500 m ArcGIS raster layers resolution 100 x 100 m (hydro) geological units with: top, base, thickness uncertainties hydraulic parameters
M Bouman TNO Nieuwehuisstijl Clay Fine sand Voxel models Clayey sand Medium sand Peat Coarse sand Anthropogenic nation-wide (~41,000 km2) upper 30 m resolution 100 x 100 x 0.5 m each voxel contains: stratigraphic unit + uncertainty lithology (sand, clay, peat) + uncertainty 15 km
M Bouman TNO Nieuwehuisstijl Parameterization of Voxel models Stratigraphy + Groundwater flow models Hydraulic conductivity Lithology and sand grain-size
M Bouman TNO Nieuwehuisstijl Measuring hydraulic conductivity • How? • Measure from samples • Pumping tests • Slug tests • Empirical relationships linking lithology and grain-size to conductivity
M Bouman TNO Nieuwehuisstijl Measuring hydraulic conductivity • Systematic sampling of stratigraphic units and lithologies in the Netherlands
M Bouman TNO Nieuwehuisstijl days Application: hydraulic resistance map • Calculated directly from measured values 70 km
M Bouman TNO Nieuwehuisstijl Scale difference between measurement and model 0.1 m 100 m
M Bouman TNO Nieuwehuisstijl Small-scale heterogeneity • Alternating sand and clay layers in a tidal environment 1 m 0.1 m 100 m 100 m low high Hydraulic conductivity (m/day)
M Bouman TNO Nieuwehuisstijl Step 1: Model the spatial distribution of sand and clay within a single voxel • Block composed of small voxels of 0.5 x 0.5 x 0.05 m • 50 realizations of sand-clay distribution 20% 80% • Sand-clay proportion 1 m 100 m 100 m Sand Clay
M Bouman TNO Nieuwehuisstijl Step 1: Model the spatial distribution of sand and clay within a single voxel • Block composed of small voxels of 0.5 x 0.5 x 0.05 m • 50 realizations of sand-clay distribution 40% 60% • 5 different sand-clay proportions 1 m 100 m 100 m Sand Clay
M Bouman TNO Nieuwehuisstijl Step 2: Model the spatial distribution of vertical hydraulic conductivity • Block composed of small voxels of 0.5 x 0.5 x 0.05 m • 5 * 50 realizations of vertical hydraulic conductivity • 5 * 50 different sand-clay distributions 1 m 100 m 100 m
M Bouman TNO Nieuwehuisstijl Step 3: Apply Modflow-model • Block composed of small voxels of 0.5 x 0.5 x 0.05 m • Effective vertical hydraulic conductivity of the entire block(m/day) Vertical flow • 5 * 50 different distributionsof vertical hydraulic conductivity
M Bouman TNO Nieuwehuisstijl 30% 70% Results • Effective vertical hydraulic conductivity of a heterogeneous sand-clay voxel Sand 40% Clay 60% N=50
M Bouman TNO Nieuwehuisstijl days Application: hydraulic resistance map • Calculated from upscaled hydraulic resistance 70 km
M Bouman TNO Nieuwehuisstijl days Application: hydraulic resistance map • Calculated from measured hydraulic resistance, without upscaling 70 km
M Bouman TNO Nieuwehuisstijl Conclusions • Systematically measure hydraulic conductivity from samples • New procedure to assign effective hydraulic conductivity values to each voxel in our models • Procedure accounts for: • difference in scale between laboratory measurements and voxels • small-scale heterogeneity within voxels
M Bouman TNO Nieuwehuisstijl Thank you for your attention Stratigraphy + Groundwater flow models Hydraulic conductivity Lithology and sand grain-size
M Bouman TNO Nieuwehuisstijl Keff = Kg * (1 + variance(ln(k)/6)) for 3D effective conductivity Kg=exp(E[ln(K)]) Gutjahr, 1978; Desbartes, 1992 This applies for the sandy facies, with almost no heterogeneity