Trig/Pre-Calculus Opening Activity
Trig/Pre-Calculus Opening Activity. Write the domain of the following functions. Solve the following inequalities. y. x. 4. -4. Definition of Graph. The graph of a function f is the collection of ordered pairs ( x , f ( x )) where x is in the domain of f . .

Trig/Pre-Calculus Opening Activity
E N D
Presentation Transcript
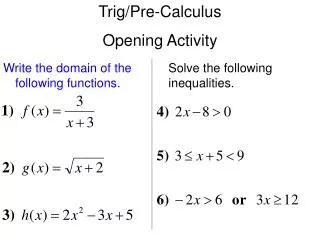
Trig/Pre-Calculus Opening Activity Write the domain of the following functions. Solve the following inequalities.
y x 4 -4 Definition of Graph The graph of a function f is the collection of ordered pairs (x, f(x)) where x is in the domain of f. (2, –2) is on the graph of f(x) = (x – 1)2 – 3. f(2) = (2 – 1)2 – 3 = 12 – 3 = – 2 (2, –2)
y x 4 -4 Domain & Range The domain of the function y = f(x) is the set of values of x for which a corresponding value ofy exists. The range of the function y = f(x) is the set of values of y which correspond to the values of x in the domain. Range Domain
Example: Domain & Range y 1 (–3, 0) x – 1 Example: Find the domain and range of the function f(x) = from its graph. Range Domain The domainis[–3,∞). The rangeis[0,∞).
y (–3, 6) 2 x –2 (3, – 4) Increasing, Decreasing, and Constant Functions A function f is: • increasing on an interval if, for any x1 and x2 in the interval, x1 < x2 implies f(x1) < f(x2), • decreasing on an interval if, for any x1 and x2 in the interval, x1 < x2 implies f(x1) > f(x2), • constant on an interval if, for any x1 and x2 in the • interval, f(x1) = f(x2). The graph of y = f(x): • increases on (–∞, –3), • decreases on (–3, 3), • increases on (3, ∞).
A function value f(a) is called a relative minimum of f if there is an interval (x1, x2) that contains a such that x1 < x < x2 implies f(a) f(x). y x A function value f(a) is called a relative maximum of f if there is an interval (x1, x2) that contains a such that x1 < x < x2 implies f(a) f(x). Minimum and Maximum Values Relative maximum Relative minimum
Graphing Utility: Approximating a Relative Minimum 6 – 1.79 – 6 6 – 0.86 2.14 – 6 – 4.79 -3.24 0.58 0.76 -3.43 Graphing Utility: Approximate the relative minimum of the function f(x) = 3x2 – 2x – 1. Zoom In: Zoom In: The approximate minimum is (0.67, –3.33).
Determine the relative minima and maxima of the following function. Determine where the graph is increasing, decreasing, and constant.
3 + x, x < 0 f(x) = x2 + 1, x 0 y x 4 -4 Piecewise-Defined Functions A piecewise-defined function is composed of two or more functions. Use when the value of x is less than 0. Use when the value of x is greater or equal to 0. opencircle closed circle (0 is not included.) (0 is included.)
y x Even Functions A function f is even if for each x in the domain of f, f(–x) = f(x). Symmetric with respect to the y-axis. f(x) = x2 f(–x) = (–x)2=x2 = f(x) f(x) = x2 is an even function.
y x Odd Functions A function f is odd if for each x in the domain of f, f(–x) = –f(x). f(x) = x3 f(–x) = (–x)3=–x3 = – f(x) Symmetric with respect to the origin. f(x) = x3 is an odd function.
Now we are going to graph the piecewise function from DNA #4-6 by HAND.
y y x x 4 4 -4 -4 Vertical Line Test Vertical Line Test A relation is a function if no vertical line intersects its graph in more than one point. y = x – 1 x = |y – 2| This graph does not pass the vertical line test. It is not a function. This graph passes the vertical line test. It is a function.
Relative Minimum and Maximum Values. We will use a graphing utility to find the following functions relative minima and maxima.
EVEN Functions ODD Functions Every EVEN function is symmetric about the y-axis. Every ODD function is symmetric about the y-axis.
Now we are going to graph the piecewise function from DNA #4-6 by HAND.
Ex 4) The net sales for a car manufacturer were $14.61 billion in 2005 and $15.78 billion in 2006. Write a linear equation giving the net sales y in terms of x, where x is the number of years since 2000. Then use the equation to predict the net sales for 2007.
Graph the following linear functions. Graph #1 – 3 on the same coordinate plane.