Download
1 / 10
100 likes | 308 Views
NEASC Assessment Workshop. Working Towards a Situational Student Success Model. William J. Gammell, Ph.D. Associate Vice President for Academic Affairs for Institutional Effectiveness Eastern Connecticut State University. Situational Student Success Model*.

E N D
NEASC Assessment Workshop Working Towards a Situational Student Success Model William J. Gammell, Ph.D. Associate Vice President for Academic Affairs for Institutional Effectiveness Eastern Connecticut State University
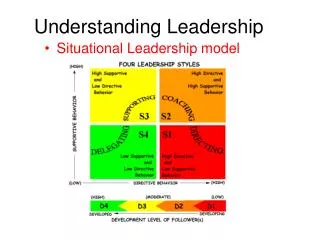
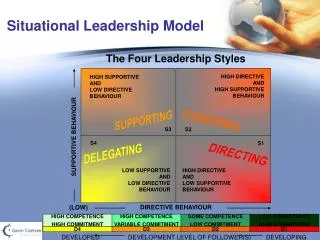
Situational Student Success Model* • Historically, models of improving academic success have focused on one dimension. • Relied on: demographics -- Race/Ethnicity, SES, 1st Gen • Past academic data -- HS GPA, SAT, Placement Exams Low to Moderate Potential Moderate to High Potential Low High Student’s Academic Potential Classic “Input” approach
Situational Student Success Model* • Limitations: • Explained variance – • Some poor prospects flourish, others do not • Some well-prepared students do not persistent Exams • Resource Issues – • Support delivered where not necessary Low to Moderate Potential Moderate to High Potential Low High Student’s Academic Potential Classic “Input” approach
Situational Student Success Model* What if…..? High Students’ Commitment/ Social Readiness Level Low Low to Moderate Potential/ High Commitment Moderate to High Potential/ High Commitment Enthusiastic Plugger Self-Reliant Achiever Low to Moderate Potential/ Low Commitment Low to Moderate Potential/ Low Commitment Capable /Needs to Engage Lost Learner Low High Students’ Academic Potential Classic “Input” approach
Situational Student Success Model* • Goal = explore other data tracking routines: • More actionable; provide opportunity for earlier interventions • Behavior-based: re-assign risk level based on student behaviors in the first semester or year of enrollment • Access to Success Leading Indicator Project provided foundation
Situational Student Success Model* • Focused on Four Sources of Behavioral Engagement • Judicial Proceedings • Student Clubs
Enrollment Patterns for First Two Years for Fall 2007, Fall 2008, Fall 2009 FTFT Cohorts at Eastern 2715 FTFT students (100%) Continually Retained Stop Out/Return Not Retained 1868 (68.8%) 17 (<1%) 830 (30.6%) Transferred Drop Out/Not Enrolled 601 (22.1%) 229 (8.4%) • 4-yr institutions 12.5% • CC 9.6%
Enrollment Patterns, Student Engagement Behavior and Characteristics for First Two Years for Fall 2007, Fall 2008, Fall 2009 FTFT Cohorts at Eastern 2715 FTFT students (100%) Continually Retained Stop Out/Return Not Retained 17 (<1%) 1868 (68.8%) 830 (30.6%) Transferred Drop Out/Not Enrolled 601 (22.1%) 229 (8.4%) (%) Pell 20.3 URM 15.6 Any offense 24.2 No Library Training 14.7 Complete Training 51.4 Any Club Year 1 8.5 True Vol Service 27.5 Sem 1 GPA > 2.0 89.2 Sem 2 GPA > 2.0 89.8 (%) Pell 24.6 URM 20.6 Any offense 28.8 No Library Training 26.0 Complete Training 38.4 Any Club Year 1 3.9 True Vol Service 17.5 Sem 1 GPA >2.0 43.4 Sem 2 GPA > 2.0 33.5 • 4-yr institutions 12.5% • CC 9.6%
Enrollment Patterns, Student Characteristics and Engagement Behaviors for 601 First Transfer Students CSU Sister = 97 (3.6%) UConn = 116 (4.3%) Other 4-YR = 126 (4.6%) (%) Pell 10.3 URM 9.7 Any offense 25.8 No Library Training 16.9 Complete Training 44.9 Any Club Year 1 5.2 True Vol Service 16.5 Sem 1 GPA > 2.0 90.7 Sem 2 GPA > 2.0 81.3 (%) Pell 12.1 URM 5.7 Any offense 30.2 No Library Training 14.4 Complete Training 56.6 Any Club Year 1 2.6 True Vol Service 20.7 Sem 1 GPA > 2.0 96.6 Sem 2 GPA > 2.0 99.0 (%) Pell 19.0 URM 7.6 Any offense 28.6 No Library Training 17.8 Complete Training 53.5 Any Club Year 1 7.1 True Vol Service 13.5 Sem 1 GPA > 2.0 88.1 Sem 2 GPA > 2.0 92.0 In State Community College = 212 (7.8%) Out of State Community College = 50 (1.8%) (%) Pell 25.5 URM 22.8 Any offense 25.5 No Library Training 25.1 Complete Training 39.4 Any Club Year 1 7.1 True Vol Service 16.5 Sem 1 GPA > 2.0 49.0 Sem 2 GPA > 2.0 42.8 (%) Pell 16.0 URM 8.9 Any offense 44.0 No Library Training 28.9 Complete Training 28.9 Any Club Year 1 8.0 True Vol Service 12.0 Sem 1 GPA > 2.040.8 Sem 1 GPA > 2.043.3
Situational Student Success Model* • Fall 2011 implemented the Library Orientation key indicator with follow-up for all new students that did not participate, or only took the on-line library assessment. • The search for other indicators continues. • * Adapted from K. Blanchard’s & Paul Hersey’s Situational Leadership Model® and Situational Leadership® II (SLII®) from The Ken Blanchard Companies both are registered trademarks of their respective companies.