Download
1 / 1
20 likes | 194 Views
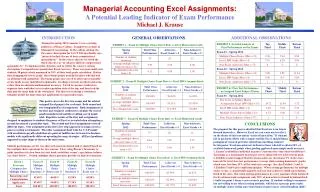
Managerial Accounting Excel Assignments: A Potential Leading Indicator of Exam Performance Michael J. Krause. INTRODUCTION During the spring 2012 semester, I was a visiting professor at Ithaca College. I taught two sections of

E N D
Managerial Accounting Excel Assignments: A Potential Leading Indicator of Exam Performance Michael J. Krause INTRODUCTION During the spring 2012 semester, I was a visiting professor at Ithaca College. I taught two sections of Managerial Accounting. In the college catalog, the the course description for ACCT 226 specifically says “projects include the use of basic computerized spreadsheets.” In the course objectives I listed the third objective as “to enhance skills in computerized spreadsheets.” To implement this objective and to reflect the course’s catalog description, I assigned to be graded nine Excel exercises. These exercises could earn students 30 points which amounted to 10% of their total grade calculation. Rather than dropping the lowest grade, three bonus points awarded to those who did well on all homework submitted. The bonus points also served to offset any reasonable errors made on any individual assignments. Grading was more on effort and setup rather than on absolute mathematical accuracy. I tried to convince students to organize their worksheet so as to place problem data at the top, and then feed the data into the main body of the worksheet. The idea was to design a worksheet template usable for more than one application of a particular topic. This poster covers the first two exams and the related assigned Excel projects for each unit. Both exams had two companion Excel assignments. Both assignments in the first unit required students to calculate the cost of goods manufactured and the resulting cost of goods sold. Repetitive nature of the first unit assignments designed to emphasize to students the power of Excel as revealed when attempting a second iteration of a particular topic. The second unit Excel assignments covered different topics. One assignment generated a five step approach to assign cost in a process costing environment. The other assignment dealt with the C-V-P model with an ultimate payoff calculation of a point of indifference between two business models with significantly different operating leverage strategies. All Excel problems appeared in some shape or form on the unit exams. Student performance on the two observed exams measured and evaluated based on the multiple choice questions for two reasons. First, using Bloom’s Taxonomy to guide question selection from text test bank establishes exams’ expectations balance (see chart below). Second, multiple choice questions provide an objective measure. GENERAL OBSERVATIONS EXHIBIT 1 – Exam #1 Multiple Choice Error Rate vs. Excel Homework Grade ADDITIONAL OBSERVATIONS EXHIBIT 2 – Exam #1 Multiple Choice Error Rate vs. Excel HW(Common-Sized) EXHIBIT 3 – Exam #2 Multiple Choice Error Rate vs. Excel Homework Grade CONCLUSIONS The proposal for this poster admitted that Excel use is no longer deemed innovative. However, Excel use can cause one to reflect on the theme of this convention “seeds of innovation.” If students fail to put forth efforts with a simple tool like Excel, should future pedagogical research prioritize identifying unwilling students? In this poster, Excel non-achievers defined as those who fail to obtain 50% of available homework points when grading not based upon simple math accuracy. 1. Exams’ credibility established in poster’s introductory chart that used Bloom’s Taxonomy as a benchmark to measure errors along with test achievement goals. 2. Exhibits 2 and 4 suggest that Excel non-achievers (less than 17% of the class) lowered the total class test performance average while earning homework grades which were less than 33% of the total class average. (See also Exhibits 1 and 3). 3. Exhibits 5 and 6 give conflicting insights. When sorting performance by multiple choice errors, a considerable majority of Excel non-achievers ended up in bottom third of the class. But when sorting performance by a test question which mirrored the Excel homework assignment, only 50% of non-achievers found in bottom third. Conflict in point 3 forms a new research question. If students willing to memorize but not willing to use other learning methods, will this fact presage poor results on multiple choice testing since that format requires more critical thinking skills? EXHIBIT 4 – Exam #2 Multiple Choice Error Rate vs. Excel HW(Common-Sized)