Acceleration
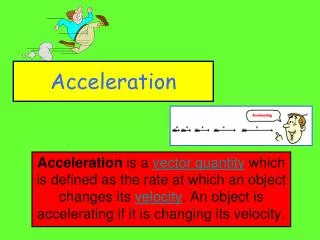
Acceleration is the change in velocity per unit time. Acceleration. When an unbalanced force acts on an object it accelerates . An unbalanced force acting on a stationary object will make it move .

Acceleration
E N D
Presentation Transcript
Acceleration is the change in velocity per unit time. Acceleration When an unbalanced force acts on an object it accelerates. An unbalanced force acting on a stationary object will make it move. An unbalanced force can make a moving object get faster or slower or change direction.
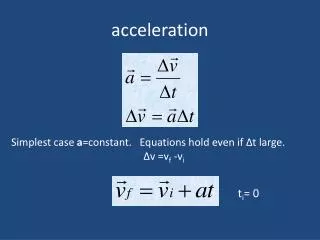
final velocity (ms-1) initial velocity (ms-1) acceleration (ms-2) time (s) The acceleration or deceleration of an object is calculated using:
Start Line Finish Line Measuring Acceleration Stopwatch Diagram Electronic Timer Length of Card Light Gate Trolley
Method A trolley is fitted with a length of card. The length of card is measured using a ruler. The trolley is released from rest, so the initial velocity is 0 ms-1. The time taken for the trolley to travel from the start to the finish line is measured using a stopwatch. An electronic timer measures the time taken for the length of card to pass through the light beam. The timer starts when the card breaks the light beam and stops when the card leaves the light beam. The final velocity is calculated using: These measurements are used to calculate acceleration in the relationship shown:
Motion Graphs There are three types of motion graph we will study: • A velocity - time graph. • A displacement – time graph. • An acceleration – time graph.
displacement-time velocity-time acceleration-time s v a t t t s v a t t t Constant Velocity Constant Acceleration
s v a t t t Constant Deceleration
12 velocity / ms-1 0 10 12 3 time / s Drawing Graphs Each velocity – time graph has a corresponding acceleration – time graph and displacement- time graph. Example The following velocity – time graph describes a journey.
Draw the corresponding acceleration – time graph. 0-3 seconds 3-10 seconds 10-12 seconds
acceleration / ms-2 4 0 time / s 3 10 12 -6
velocity / ms-1 24 20 time / s 0 9 13 16 4 Q1. Copy out the following velocity - time graph and underneath it draw the corresponding acceleration – time graph.
0-4 seconds 4-9 seconds 9-13 seconds 13-16 seconds
acceleration / ms-2 5 1 0 time / s 4 9 13 16 - 8
acceleration / ms-2 5 0 time / s 4 8 18 -2 Q2. Using the following acceleration – time graph of an object starting from rest, draw the corresponding velocity – time graph.
velocity / ms-1 20 0 time / s 4 8 18
velocity / ms-1 15 3 0 time / s 3 7 9 14 18 24 -9 Q3. Copy out the following velocity – time graph and underneath it draw the corresponding acceleration – time graph (after appropriate calculations).
0-3 seconds 3-7 seconds 7-9 seconds 18-24 seconds 9-14 seconds 14-18 seconds
acceleration / ms-2 4 0 3 7 9 14 18 24 time / s -6
Motion and Direction In the velocity-time graphs so far, motion has been in only one direction. A velocity time graph however can show two different directions; one direction is positive, while the other is negative.
Example 1 A car travelling along a straight section of road has the following velocity-time graph. forward motion backward motion (a) Calculate the distance travelled by the car. (b) Calculate the displacement of the car.
(a) Distance travelled is the area under velocity-time graph. (b) Displacement is the forwards motion, less the backward motion.
Worksheet – Graphs of Motion Q1 – Q9
velocity / ms-1 time / s Ball Thrown Into Air A ball is thrown directly upwards into the air. It rises into the air and falls back down to the thrower. The velocity – time graph and corresponding acceleration – time graph are shown.
-9.8 acceleration / ms-2 time / s
velocity / ms-1 time / s Bouncing Ball (No Energy Loss) A ball is dropped from a height to the ground. The ball bounces twice with no energy loss and is then caught. The velocity - time and acceleration - time graphs are as follows: max height rising rising falling falling downwards (falling): - ve upwards (rising): + ve hits ground
acceleration / ms-2 time / s -9.8
velocity / ms-1 downwards (falling): + ve upwards (rising): - ve time / s TASK Re-draw the velocity-time graph for the bouncing ball, taking downward motion as positive, and upward motion as negative. hits ground falling falling rising rising max height
velocity / ms-1 time / s Bouncing Ball (With Energy Loss) A ball is dropped from a height to the ground. Kinetic energy is lost with each bounce. The velocity - time and acceleration - time graphs are as follows:
acceleration / ms-2 time / s -9.8 TASK Re-draw the velocity-time graph for the bouncing ball, taking downward motion as positive, and upward motion as negative.
Equations of Motion There are three equations of motion. You must be able to use and derive these three equations of motion. 1st Equation of Motion
velocity/ms-1 time/s 2nd Equation of Motion To derive the second equation of motion, the velocity-time graph shown is used as a starting point. v v - u u t Displacement (s) is the area under a velocity time graph.
but from equation (1): so we can rewrite as:
3rd Equation of Motion This equation links final velocity (v) and displacement (s). taking a common factor of 2a gives and since s = ut + ½at2
* * * Direction When using the equations of motion, it is essential that direction is considered. In these examples, upward motion is taken as positive, so any downward motion is taken to be negative. Example A helicopter is travelling upwards with a velocity of 25 ms-1. A package is released and hits the ground 14 s later. Path of Package stationary ( 0 ms-1 ) released hits ground
Choose the upward direction as positive! This example has motion in two directions. It is necessary to distinguish between the two directions. (a) How long will it take the package to reach its maximum height? (2)
(b) How high as it climbed since being released? (2) (c) Calculate the velocity of the package just before it hits the ground. (2) The negative indicates travelling downwards.
(d) How high above the ground is the helicopter when the package is released? (2) So the helicopter is 610.4 m above the ground.
Worksheet – Equations of Motion Q1 – Q15
Acceleration Due To Gravity Diagram Timer Ball Bearing Trap Door
Method The ball bearing is released from rest, so initial velocity (u) is 0 ms-1. The displacement (s) of the ball bearing is the distance between the release point and trap door, and is measured using a metre stick. An electronic timer measures the length of time taken for the ball bearing to reach the trap door. Calculation
Projectiles (Half Trajectory) An object projected sideways through the air will follow a curved trajectory. horizontal motion (steady speed) vertical motion accelerates downwards at -9.8 ms-2 The horizontal and vertical motions should be treated separately. Time is the only quantity common to both.
vh This is an example of a ‘half-trajectory.’ vv GREEN – actual motion RED – vertical motion BLUE – horizontal motion
At any point in its trajectory, the velocity of a projectile has twocomponents. • one vertical, VV • the other horizontal, VH The resultant velocity is found drawing a vector diagram and add the vectors together, TIP to TAIL. Vector Diagram horizontal velocity vertical velocity resultant/actual velocity
Example A ball is kicked horizontally off an embankment, with a velocity of 30 ms-1. It lands 24 m from the base of the embankment. (a) Calculate how long the ball was in flight. 30 ms-1 24 m common to horizontal and vertical motions
(b) Calculate the horizontal velocity just before hitting the ground. acted upon by gravity Horizontal Vertical not initially falling down, so speed of zero in vertical direction travels horizontally at steady speed – no acceleration horizontally Horizontal
(c) Calculate the vertical velocity just before hitting the ground. Vertical means 7.84 ms-1 downwards (d) How high is the embankment? Vertical means ball fell through distance of 3.14 m so height of the embankment is 3.14 m
30 ms-1 -7.8 ms-1 (e) Calculate the resultant velocity of the ball, just before hitting the ground. velocity Size By Pythagoras:
30 ms-1 -7.8 ms-1 velocity Direction