Download
1 / 15
150 likes | 402 Views
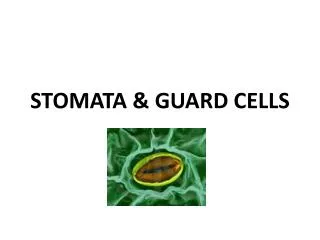
Stomata Density Among Campus Grasses During Winter. Chris Collett Undergraduate in Secondary Education: Biology Education Department Tennessee Technological University P.O. Box 10583 Cookeville, TN 38505 Date: April 25, 2007. Introduction:. Stomata are the tiny pores leaves

E N D
Stomata Density Among Campus Grasses During Winter Chris Collett Undergraduate in Secondary Education: Biology Education Department Tennessee Technological University P.O. Box 10583 Cookeville, TN 38505 Date: April 25, 2007
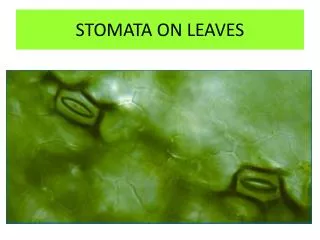
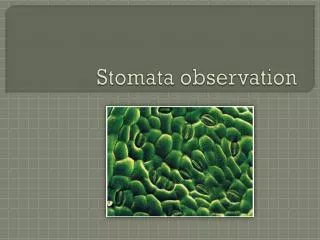
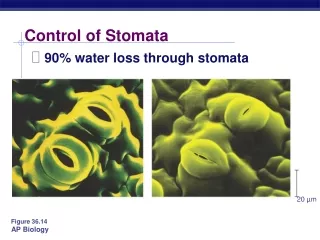
Introduction: • Stomata are the tiny pores leaves • Control of plant transpiration and photosynthesis (Jones 1997). • Until the early 90’s (Beerling and Chaloner 1993), no research on the effects of CO2 and temperature on stomata. • Only research found on the effects of CO2 and temperature were on salt marsh communities (Curtis et al 1989), herbaceous species in controlled conditions (Hunt et al 1991), and the vegetation of arctic tundra (Tissue and Oechel 1987).
Introduction Continued… • Even less research has been done on the effects of winter on stomata. • I will test the temperature effects only (not with CO2). • The purpose of this experiment is to see which type of grass, at Tennessee Tech University, has the highest stomata during the winter.
Introduction Cont… • Objective: The objective of this experiment is to determine which type of grass on the campus of Tennessee Tech has the most stomata during the Winter. • Hypothesis:In this experiment, I will be testing my hypothesis that Fescue grass has the most stomata due to is tremendous success in reproduction and survival. • Null Hypothesis:The null hypothesis for this experiment is that there will be no significant difference in stomata density between the three types of grass (Rye, Fescue, and Kentucky Bluegrass).
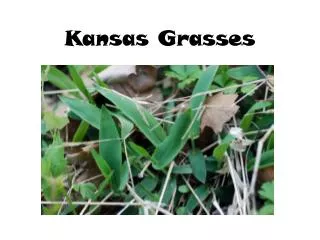
The types of grass being tested… • Bluegrass Fescue Rye
Methods and Materials • Gather the right amount of the appropriate types of grass. • Keep the grass in separate piles. • Gather materials and set up lab: microscope, grass, clear fingernail polish, clear tape, microscope slides and covers, paper, and pencil. (All materials obtained, and the experiment performed at Tennessee Technological University.) • Select type of grass and paint the underside with clear fingernail polish (thick!). Let grass completely dry. • After grass dries, get piece of clear tape and attach to a dried polish on grass. (Gently) peel nail polish swath from the leaf.
Methods Continued… • Stick tape to microscope slide and cut off excess tape from slide. (label the slide) • Put slide under microscope and focus until stomata appear. (small pores surrounded by banana-shaped cells). Set Power to 400X (20-75 stomata in view). • find section with no major flaws and a high stomata count (3 sections per blade). • Count stomata and record data. • Repeat process (from tape to stomata count and recording) for the remaining grass type in use. • Repeat entire process (from nail polish onward) for the other two types of grass. • Results will be analyzed by using a t-test (Koning 1994).
Results • The results are broken down within a series of tables, figures, and graphs… • Table 1- List of grass types with stomata counted. • Tables 2, 3, and 4- (t-tests)- table 2 compares Fescue/Rye; table 3 compares Rye/Bluegrass; table 4 compares Bluegrass/Fescue. • Figure 1/Graph 1- line graph comparing the gathered data from the grasses’ stomata count. • Figures 2, 3, and 4- pictures of the three types of grass test at the campus. (Fescue, Rye, and Bluegrass)
Discussion • Point of research- “[…] summarize the types of response[s] expected for a limited number of different stomatal control mechanisms […]” (Jones 1998). • Temperature, CO2, and soil concentrations. • Some critics have mentioned that the stomata count may change with an increase in temperature/climate. • However, “there is no significant (P< 0.05) relationship between stomatal index and temperature” (Beerling and Chaloner 1993). • In fact, most all “recent work on the impact of climate change on plant life has concentrated on the direct, or ‘fertilizer’, effect of elevated CO2 (Hunt et al 1991).
Discussion continued • Still, “the effect of continuous exposure to enhanced atmospheric CO2 levels on overall plant growth and development is, however, still uncertain” (Thomas and Harvey 1983). • Results based on 2 types of data: stomata average and t-tests (comparing groups 1&2, 2&3, and 1&3). • Fescue grass held the most stomata (average=44.07). The next closest grass type, Rye grass (average=36.67). The final type of grass tested, Kentucky bluegrass (average=24.67), held the lowest count. • The results are determined for the test through 2 different factors: the P (T<=t) two-tail value and the t Stat value line.
Discussion Continued • if the P (T<=t) two-tail is less than 0.05, then the two groups are significantly different from each other. Also, if the t Stat > t Critical two-tail, then the two groups are significantly different. • with all the gathered information/results, one can see that our hypothesis was correct. • In other words, all three tests ran comparing the three types of grass found a significant difference in the results. • Test 1- (P (T<=t) two-tail= 3.56E-11;and t stat= +8.41) • Test 2- (P (T<=t) two tail= 2.07E-15; and t stat= +13.66) • Test 3- (P (T<=t) two tail= 2.1E-22 and t stat= +26.89)
Conclusions: • According to the results of the t-test, it can be concluded that our hypothesis was correct. • In every test performed, there seemed to be a significant difference in the results. • As far as the stomata count average, the Fescue, as predicted, held a higher average, as well as higher individual blade numbers, than the other two grass types • As stated in the research, the results were predicted in this manner due to the success (survival and breeding) of this type of grass throughout the campus. • Through the test’s results, one may be able to find a way to strategically plant this type of grass in an attempt to reverse the greenhouse affect.
Questions???? ? ? ? ? ? ? ? ?