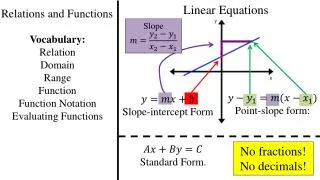
2.4 Relations and Functions
2.4 Relations and Functions. Defn: A relation is any correspondence between two sets of data. A relation may be represented by a mapping or chart, a list of ordered pairs, a table, a graph, or an equation. Set X. Set Y. 867-5309 555-1212 729-0000 555-5411. Grandma Boss Jenny

2.4 Relations and Functions
E N D
Presentation Transcript
2.4 Relations and Functions • Defn: A relation is any correspondence between two sets of data. • A relation may be represented by a mapping or chart, a list of ordered pairs, a table, a graph, or an equation.
Set X Set Y 867-5309 555-1212 729-0000 555-5411 Grandma Boss Jenny Suzy Q Mapping Set of ordered pairs {(4,3), (7,5), (1,2), (4, 5)} Table
Domain and Range • The domain of a relation is the set of all possible input values. • The input variable is called the independent variable, or argument, and is usually denoted by x. • The range of a relation is the set of all possible output values. • The output variable is called the dependent variable, or value of the function, and is usually denoted by f(x) or y.
Finding Domain and Range • For mappings, sets of ordered pairs, or tables, the domain is a listing of the x-values put in { }, and the range is a listing of the y-values put in { }. • Ex. Find the domain and range of the relation given by { (0, 2), (4, -7), (6, 5), (0, -8)}
Finding Domain and Range 190 130 210 185 62 70 72
The Domain and Range of a Graph Most often, the domain and range of a graph is described by intervals rather than lists. The domain is the interval(s) on the x-axis which has corresponding points on the graph. The range is the interval(s) on the y-axis which has corresponding points on the graph.
Ex. Find domain and range of the relations shown below. Domain: Domain: [-3, 1] or Range: [-1, 3] or Range:
Ex. Find domain and range of the relations below Domain: Domain: Range: Range:
Ex. Find domain and range of the relations below Domain: Domain: Range: Range:
Functions • A function is a type of relation where each input has only one output. • Another way to think of a function is that each x-value can be paired with only one y-value. Ex. { (-2, 4), (-1, 2), (0, 4), (1, -2), (2, 3)} {(5, 10), (-4, 3.1), (-1, 2.5), (5, 7)}
Is it a function? 1) 2) 867-5309 555-1212 729-0000 555-5411 Grandma Boss Jenny Suzy Q Marie Jessie Ellen Phillip Brian Seth Ryan 3.) { (1,0), (2, 3), (4, -7), (1, -5) } 4.)
Vertical line test • A graph represents a function if any vertical line passes through the graph only once. Which of the following are functions? Not a function This is a function
Graphs of functions Consider the following graphs. Which is a function and why?
How to tell if an equation is a function • An equation is a function if it can be solved uniquely for y. • Which of the following are functions? A) x2 + 2xy3 = 9 B) x2 + y2 = 1 C) y3 - xy = 9 D)
Function Notation • If an equation is a function, then we say that “y is a function of x” or in symbols: y = f(x). • We write equations in function notation by solving for y, then replacing y with f(x). • 2x2 + y = 1 is written in function notation as f(x) = 1 – 2x2
Some notes on function notation. • The symbol f(x) is just another symbol for y. • f(x) is read “f of x” and the ( ) do not mean multiplication here. • The function is independent of the letter used to represent it: and represent the same function.
Evaluating a function. • In function notation, we replace x with a number, then simplify to find y. • For example: Let f(x) = 2x – 4. Find f(3). f(3) = 2(3) – 4 f(3) = 6 – 4 f(3) = 2 When x = 3, the y-value is 2.
Evaluating a function. • Ex. Let f(x) = -x2 + 5, find f(-5).
Domain of a function. • The domain of a function is all real x’s where the function exists. • If the function contains a denominator, set the denominator ≠ 0 and solve for x. • If the function contains a square root, set the argument of the root ≥ 0 and solve for x. • If the function has no square roots and no denominators, the domain is (-∞, ∞).
Domain of a function. • Find the domain of:
Domain of a function. • Find the domain of:
Domain of a function. • Find the domain of:
Finding Function Values from Graphs Note that f(a) = b can be written as the ordered pair (a, b). Use the graph to find the following: f(x) 1.) f(2) 2.) f(1) 3.) f(-1)
Finding function information from graph 1.) Find the domain and range of f(x). 2.) Find the intercepts of f(x). 3.) Find f(-5), f(0), and f(2). 4.) Solve f(x)= -2.