Download
1 / 32
320 likes | 549 Views
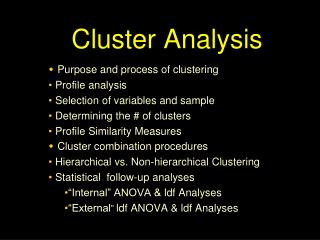
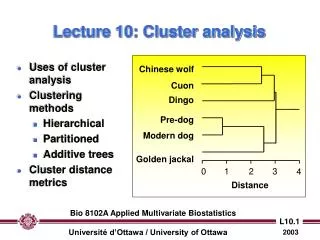
Uses of cluster analysis Clustering methods Hierarchical Partitioned Additive trees Cluster distance metrics. Chinese wolf. Cuon. Dingo. Pre-dog. Modern dog. Golden jackal. 0. 1. 2. 3. 4. Distance. Lecture 10: Cluster analysis.

E N D
Uses of cluster analysis Clustering methods Hierarchical Partitioned Additive trees Cluster distance metrics Chinese wolf Cuon Dingo Pre-dog Modern dog Golden jackal 0 1 2 3 4 Distance Lecture 10: Cluster analysis Bio 8102A Applied Multivariate Biostatistics
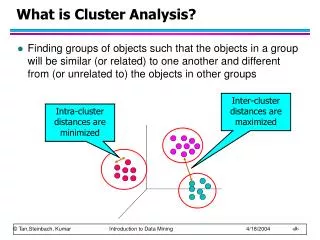
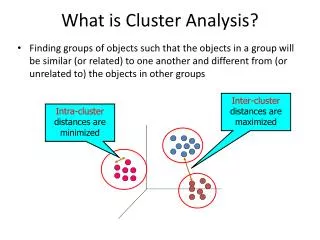
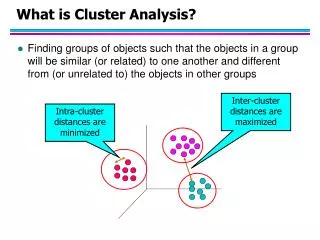
Given a set of p variables X1, X2,…, Xp, and a set of N objects, the task is to group the objects into classes so that objects within classes are more similar to one another than to members of other classes. Questions of interest: does the set of objects fall into a smaller set of “natural” groups? What are the relationships among different objects? Note: in most cases, clusters are not defined a priori. Cluster analysis I: grouping objects Bio 8102A Applied Multivariate Biostatistics
Given a set of p variables X1, X2,…, Xp, and a set of N objects, the task is to group the variables into classes so that variables within classes are more highly correlated with one another than to members of other classes. Questions of interest: does the set of variables fall into a smaller set of “natural” groups? What are the relationships among different variables? Cluster analysis II: grouping variables Bio 8102A Applied Multivariate Biostatistics
Given a set of p variables X1, X2,…, Xp, and a set of N objects, the task is to group the objects andvariables into classes so that variables and objects within classes are more highly correlated with/more similar to one another than to members of other classes. Questions of interest: does the set of variables/objects combinations fall into a smaller set of “natural” groups? What are the relationships among the different combinations? Cluster analysis III: grouping objects and variables Bio 8102A Applied Multivariate Biostatistics
The basic principle • Objects that are similar to/highly correlated with one another should be in the same group, whereas objects that are dissimilar/uncorrelated should be in different groups. • Thus, all cluster analyses begin with measures of similarity/dissimilarity among objects (distance matrices) or correlation matrices. Bio 8102A Applied Multivariate Biostatistics
Clustering objects • Objects that are closer together based on pairwise multivariate distances or pairwise correlations are assigned to the same cluster, whereas those farther apart or having low pairwise correlations are assigned to different clusters. Bio 8102A Applied Multivariate Biostatistics
Clustering variables • Variables that have high pairwise correlations are assigned to the same cluster, whereas those having low pairwise correlations are assigned to different clusters. Bio 8102A Applied Multivariate Biostatistics
Clustering objects and variables • Object/variable combinations are classified into discrete categories determined by the magnitude of the corresponding entries in the original data matrix • Allows for easier visualization of object/variable combinations. Bio 8102A Applied Multivariate Biostatistics
Types of clusters • Exclusive: each object/variable belongs to one and only one cluster. • Overlapping: an object or variable may belong to more than one cluster. Exclusive clusters Overlapping clusters Bio 8102A Applied Multivariate Biostatistics
Scale considerations • In general, correlation measures are not influenced by differences in scale, but distance measures (e.g. Euclidean distance) are affected. • So, use distance measures when variables are measured on common scales, or compute distance measures based on standardized values when variables are not on the same scale. Bio 8102A Applied Multivariate Biostatistics
Chinese wolf Cuon Dingo Pre-dog Modern dog Golden jackal 0 1 2 3 4 Distance Exclusive clustering methods I. Hierarchical clustering of objects • Begins with calculation of distances / correlations among all pairs of objects… • … with groups being formed by agglomeration (lumping of objects) • The end result is a dendogram (tree) which shows the distances between pairs of objects. Bio 8102A Applied Multivariate Biostatistics
Exclusive clustering methods I. Hierarchical clustering of variables • Begins with calculation of correlations/distances between all pairs of variables… • … with groups being formed lumping of highly correlated variables. • The end result is a dendogram or tree which shows the distances between pairs of variables. MOLARBR MANDBRTH MOLARL MANDHT MOLARS MOLARS2 0 5 10 15 Distance Bio 8102A Applied Multivariate Biostatistics
Hierarchical clustering of objects and variables • Standardized data matrix is used to produce a two-dimensional colour/shading graph with colour codes/shading intensities determined by the magnitude of the values in the original data matrix… • …which allows one to pick out “similar” objects and variables at a glance. Bio 8102A Applied Multivariate Biostatistics
Single (nearest-neighbour): distance between two clusters = distance between two closest members of the two clusters. Complete (furthest neighbour): distance between two clusters = distance between two most distant cluster members. Centroid : distance between two clusters = distance between multivariate means of each cluster. Hierarchical joining algorithms Centroid Cluster 1 Single Cluster 2 Cluster 3 Complete Bio 8102A Applied Multivariate Biostatistics
Average: distance between two clusters = average distance between all members of the two clusters. Median: distance between two clusters = median distance between all members of the two clusters. Ward: distance between two clusters = average distance between all members of the two clusters with adjustment for covariances. Hierarchical joining algorithms (cont’d) Cluster 1 Cluster 2 Cluster 3 Mean/median/adjusted mean of all pairwise distances Bio 8102A Applied Multivariate Biostatistics
Simple joining (nearest neighbour) Distance matrix Bio 8102A Applied Multivariate Biostatistics
Complete joining (furthest neighbour) Distance matrix Bio 8102A Applied Multivariate Biostatistics
Average joining Distance matrix Bio 8102A Applied Multivariate Biostatistics
Median joining Distance matrix Bio 8102A Applied Multivariate Biostatistics
Centroid joining Distance matrix Bio 8102A Applied Multivariate Biostatistics
Ward joining Distance matrix Bio 8102A Applied Multivariate Biostatistics
1 2 3 4 5 1 2 3 ? 4 5 Important note! • Centroid, average, median and Ward joining need not produce a strictly hierarchical tree with increasing lumping distances, resulting in “unattached” branches. • If you encounter this problem, try another method! Cluster Tree Bio 8102A Applied Multivariate Biostatistics
Exclusive hierarchical clustering II. Partitioned clustering • In partitioned clustering, the object is to partition a set of N objects into a number kpredetermined clusters by maximizing the distance between cluster centers while minimizing the within-cluster variation. Bio 8102A Applied Multivariate Biostatistics
Objects Seeds Object center Partitioned clustering: the procedure X1 • Choose k “seed” cases which are spread apart from center of all objects as much as possible. • Assign all remaining objects to nearest seed. • Reassign objects so that within-group sum of squares is reduced… • …and continue to do so until SSwithin is minimized. Seed 1 Seed 2 Seed 3 X2 Bio 8102A Applied Multivariate Biostatistics
K-means clustering • Because k-means clustering does not search though every possible partitioning, it is always possible that there are other solutions yielding smaller SSwithin. • A method of partitioned clustering whereby a set of k clusters is produced by minimizing the SSwithin based on Euclidean distances. • This is very much like a single-classification MANOVA with k groups, except that groups are not known a priori. Bio 8102A Applied Multivariate Biostatistics
K-means partitioning: example k =2 clustering of 6 dog species • Cluster profile plots give z-scores for each variable used in clustering objects, with variables ordered by univariate F ratios • Zero indicates mean of all objects. • The more similar the profiles for objects within a cluster, the smaller the within-cluster heterogeneity. Bio 8102A Applied Multivariate Biostatistics
K-means partitioning: example k =2 clustering of 6 dog species • Cluster means plots give means for each variable used in clustering objects, with variables ordered by univariate F ratios • Dashed indicates mean of all objects . • The greater the difference in group means, the greater the discriminating ability of the variable in question Bio 8102A Applied Multivariate Biostatistics
Some clustering distances Bio 8102A Applied Multivariate Biostatistics
Exclusive non-hierarchical clustering : Additive trees • In additive trees clustering, the objective is to partition a set of N objects into a set of clusters represented by additive rather than hierarchical trees. • For hierarchical trees, we assume: (1) all within-cluster distances are smaller than between cluster distances; (2) all within-cluster distances are the same. For additive trees, neither assumption need hold. Bio 8102A Applied Multivariate Biostatistics
1 2 3 4 5 Additive trees • In additive tree clustering, branch length can vary within clusters… • … and objects within clusters are compared by considering the sum of the branch lengths connecting them Hierarchical tree 1 2 3 4 5 Additive tree Bio 8102A Applied Multivariate Biostatistics
Additive trees joining 5 Distance matrix 7 4 3 9 2 8 6 1 D1,3 = 1.5 + 4.0 + 0.5 = 6.0 Bio 8102A Applied Multivariate Biostatistics
Deciding what to cluster and how to cluster them Bio 8102A Applied Multivariate Biostatistics