Download
1 / 19
190 likes | 284 Views
This study analyzes Pb concentration in rat liver and kidney, mice body weight under different diets, and Cd content in hepatic tissue at varying pH levels using statistical tests to determine significance. Results show how to interpret data with confidence intervals.

E N D
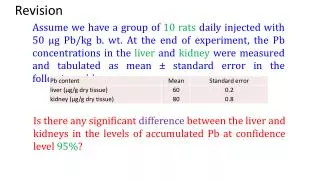
Revision Assume we have a group of 10 rats daily injected with 50 µg Pb/kg b. wt. At the end of experiment, the Pb concentrations in the liver and kidney were measured and tabulated as mean ± standard error in the following table: Is there any significant difference between the liver and kidneys in the levels of accumulated Pb at confidence level 95%?
Solution: So we want to test the null hypothesis H0: σ22 = σ12 against the alternate hypothesis HA: σ22≠ σ12 (2-tailed) d.f.= 10 – 1 = 9 F0.025(9,9) = 4.03 In this case, Fcalc(17.78) > Ftabulated(4.03), so we reject H0that the two standard deviations are unequal,so P < 0.05
Three diets (I, II, III) for mice were tested for differences in body weight (in grams) after a specified period of time. The results are recorded in the following table: Does the type of diet significantly affected the body weight of mice at confidence levels of 95% and 99 %? Compare between group I and II.
Solution For I, σ2=25 For II, σ2=68.75 For III, σ2=63.75
= 1316.66 dfB= h-1= 3-1= 2 MSB= SSB/dfB= 658.33
= 472.5 dfW= N-h= 12-3= 9 MSW= SSW/dfW= 52.5
F0.05 (2, 9)= 4.26 F0.01 (2, 9)= 8.02
Tukey’s HSD (Honestly significance difference) Post-hoc test Number of groups = number of means Total number of Samples The critical value for comparison between two averages Critical q value (tabulated) Sample size /group
Tukey’s HSD (Honestly significance difference) Post-hoc test Q= 3.95 (3.62)=14.31 -= 7.5 <Q (14.31) insignificant
N (total sample size)- g (number of groups) g (3) 12– 3= 9
The data below represent the levels of blood glucose before and after injection with a certain herbal extract. Did the herbal extract cause increased blood glucose levels??
d.f. = n - 1 ttabulated at d.f. 5 = 2.015 tCal(12.84) > ttabulated(2.015) Significant, P<0.05 =12.84
In an experiment to study the effect of pH value on the hepatic Cd content, the data below were recorded. Test the claim that Cd content at pH 8 is significantly higher than at pH 5?
d.f.= n1 + n2 - 2 = 7+11 -2= 16 =15.73 =12
= = 1.001 ttabulated at d.f. (7+11-2) = 1.746 tCal (1.001) < ttabulated(1.746) Insignificant, P>0.05