Download
1 / 30
310 likes | 499 Views
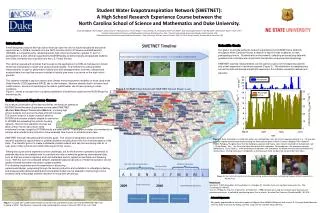
Evapotranspiration (ET) in the Lower Walker River Basin, West-Central Nevada. By Kip K. Allander, J. LaRue Smith, Michael J. Johnson, U.S. Geological Survey, Nevada Water Science Center and Robert Pattison U.S. Department of Agriculture, Agricultural Research Service.

E N D
Evapotranspiration (ET) in the Lower Walker River Basin, West-Central Nevada By Kip K. Allander, J. LaRue Smith, Michael J. Johnson, U.S. Geological Survey, Nevada Water Science Center and Robert Pattison U.S. Department of Agriculture, Agricultural Research Service Nevada Water Resources Association 2006 Annual Conference; Mesquite, NV February 23, 2006
Main area of interest for ET study Overview • Objective • Study Design • ET Network • Scaling up of ET • Results • ET at Walker Lake • ET at Saltcedar • ET summary
and from open-water surfaces. Natural Vegetation, Agricultural Vegetation, Objective The primary objective of the ET component of the Walker River Basin project is to estimate ET losses from . . . Photo by Jim Crompton
RAWS Dead Camel Site Study Design • 8 ET Stations • 5 are Bowen-ratio method • 3 are Eddy-covariancemethod (3D)
This image is an example of an ET unit map obtained from Laczniak and others, 2001, Ground-water discharge determined from estimates of ET, Death Valley Regional Flow System, NV and CA: USGS WRIR 01-4195, p. 23. Quantifying ET across the Study Area • Create map of ET units • Airborne imagery • Lidar
Imagery (infrared) • Color infrared imagery will be used to classify vegetation based on its relative vigor and soil conditions.
Imagery (natural color) • Natural color imagery will be used to define the extent of riparian and phreatophytic vegetation.
Lidar • Lidar imagery will be used to estimate vegetation density and canopy height.
Data gaps Measured E on Walker Lake
Data gaps E compared with Net Radiation on Walker Lake
RAWS – Dead Camel Site Photo obtained from http://www.wrcc.dri.edu/wraws/pictures/ndea/200509/ndea.ST3.jpg
Total E for Water Year (WY) 2005 Total E, WY 2005 = 1,814 mm or 6.0 ft* * Provisional data has not received final approval and is subject to change with further review
Results – ET from Walker Lake • Preliminary estimate of ET for WY 2005 was 6.0 ft*, up from previous estimates of 4.1 ft. • Surface area of Walker Lake in June 2005 was 32,000 acres. • Estimated water volume evaporated from Walker Lake in WY2005 was 191,000 acre-ft*. • ~ 50% increase over previous estimates. • If relation between lake ET and RAWS solar radiation data holds, may be able to estimate annual ET back to 1999. * Provisional data has not received final approval and is subject to change with further review
Saltcedar site • Site underwent substantial defoliation due to introduction of a biologic control agent: Saltcedar Leaf Beetle (Diorhabda elongata) • Changed characteristics and ET rate for large stand of Saltcedar Photo by Robert Pattison
Error bars represent standard error Red line represents a “Conceptual ET Curve” for a vegetation with shallow depth to ground water, such as is the case with this site. This conceptual curve is intended to demonstrate seasonal variability more than seasonal magnitude. Measured ET at Saltcedar
Period used in regression Comparison with Saltgrass ET
Reduction of ET using Saltgrass comparison This is a 22% reduction in ET* 57 mm* 203 mm* * Provisional data has not received final approval and is subject to change with further review
Period used in regression Comparison with Willow ET
Reduction of ET using Willow comparison This is a 22% reduction in ET* 58 mm* 203 mm* * Provisional data has not received final approval and is subject to change with further review
Results – Saltcedar site • Saltcedar underwent substantial defoliation and associated reduction of ET due to introduction of biologic agent. • ET rate may have been reduced by more than 20%, but a reduction even greater than this is likely. • Saltcedar ET rates of 4.0 ft/yr have been observed in Southern Nevada. • Actual pre-Saltcedar Beetle ET rates from Saltcedar in study area are undetermined at this time.
Results – ET Summary 6.0 ft* 3.5 ft* 3.3 ft* 2.8 ft* 0.7 ft* 0.7 ft* 0.4 ft* 0.4 ft* * Provisional data has not received final approval and is subject to change with further review
Summary • Open water has the greatest ET rates, followed by Willows and then Alfalfa. • E from Walker Lake for 2005 water year was nearly 6 ft*, almost 2 ft greater than previous estimates. • Estimated volume evaporated from Walker Lake is approximately 50%* greater than previous estimates. • ET rates in Saltcedar were reduced by more than 20%* with newly introduced biologic control, but a reduction even greater than this is likely. * Provisional data has not received final approval and is subject to change with further review