Download
1 / 55
550 likes | 647 Views
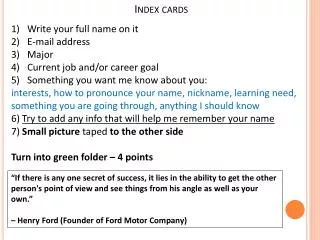
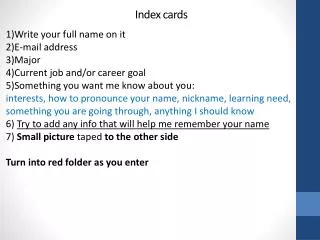
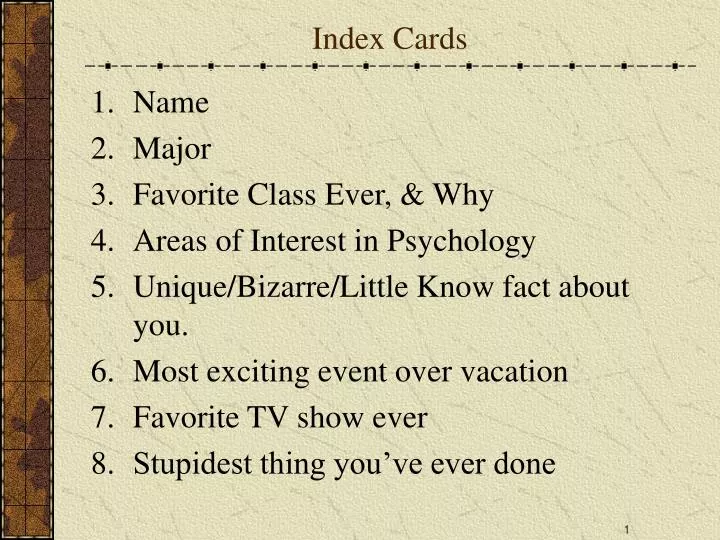
Index Cards. Name Major Favorite Class Ever, & Why Areas of Interest in Psychology Unique/Bizarre/Little Know fact about you. Most exciting event over vacation Favorite TV show ever Stupidest thing you’ve ever done. Small Group Questions. Name, where you’re from Best class ever & why

E N D
Index Cards • Name • Major • Favorite Class Ever, & Why • Areas of Interest in Psychology • Unique/Bizarre/Little Know fact about you. • Most exciting event over vacation • Favorite TV show ever • Stupidest thing you’ve ever done
Small Group Questions • Name, where you’re from • Best class ever & why • Stupidest thing you’ve ever done • Bizarre facts/tricks you can do
Pop Quiz #1 1. Your instructor is from… • Nevada • New York • Nebraska • Minnesota • East-central Tibet
Pop Quiz #1 2. Your instructor has taught statistics • Never • About 10 times • About 20 times • About 30 times • About 40 times • Way, way too many times
Pop Quiz #1 3. Your instructor was once bitten by a … • Rattle Snake • Polar Bear • South American Malting Meek Mouse • Snapping Turtle • An oversized freshman • His wife, after refusing to mow the lawn
Pop Quiz #1 4. Your instructor can’t get enough… • Chocolate • Schlitz Malt Liquor • Diet Pepsi • Diet Coke • Diet Schlitz Malt Liquor • Prune Juice • Red Bull
Pop Quiz #1 5. Your instructor’s 2nd favorite TV show is … • Married with Children • The Simpsons • Survivor #5: Downtown Rockhill • The Daily Show • Space Ghost • Seinfeld • NOVA – Deadly Snapping Turtles
Course Tips Types of Data Graphing Distributions The Normal Curve Graphing Sample Means Practicing with SPSS Stats Basics: 1st Week Overview
Syllabus Office hours Engagement & Attendance Quizzes Request for leniency Notebook Course Packs Organization Homework, Labs, & Reading Class time Set-up first Please avoid surfing Bulldog Tactics Note-taking Write & Process Ask questions! Slow me down! Homework ** Studying ** Often Active Self-Explanation Practicing SPSS Laugh at my jokes!! Secret Course Tips
Option A: Solo Every Penguin For Herself! Keep the competition down. Option B: Teamwork!!! Ask questions of peers Answer questions Form study groups Practice explaining Make Friends Quickly!!
Terminology: Samples vs. Populations • Samples & Populations • Statistics: refer to characteristics of samples • e.g., xbar or M • always regular alphabet symbols • Parameters: refer to characteristics of population • e.g. μ • always greek symbols • Self-check: • height of several students in class to represent class • height of class to represent height of typical undergraduates
Qualitative vs. Quantitative Data • Quantitative: can be ranked • shoe size, height, self-esteem score on scale, airplane lift • Qualitative: can’t be ranked • gender, political affiliation, major, car maker • Check • Gender • region • weight • depression • steps • Social Security Number • Letter Grade: A, B, C, D
Nominal – classify data into categories (religion) Ordinal – classify and rank (Olympic Medals) Interval – classify and rank with equal intervals (Celsius) Ratio – classify, rank with equal intervals, true zero (Kelvin) your residence hall batting average your rank on mom’s love list height IQ weight Self-esteem (7 point Likert Scale) SAT score Scales of measurement • Grade: A, B, C, D • distance • gender • gpa • number of close friends • social security number • region of country • level of depression
Experimental terms • Empirical Method: Experimental Method • Question: Why do airplanes fly? • Theory: Wings create lift • Operational Definitions • IV: Wing position: (straight, bent up) ‘levels’ • DV: Lift • Gathering data • Careful observation; quantification • Level of measurement – use highest possible • Controlling Extraneous Variables • Drawing Conclusions
Experimental terms (2) • Experimental Terminology • Independent Variable: (e.g., Wing Position) • Variable you manipulate; • variable you think will impact DV • Dependent Variable: (e.g., Change in Vertical Position) • Variable that might be affected by IV; • variable you measure • Extraneous Variable: (e.g., drafts, throwing style) • Any fact that affects the DV other than the IV • Sources of “error” – we want to STANDARDIZE conditions to minimize the amount of error • Quasi Experimental Design • No manipulation of IV
Experimental terms (3) • Practice • Can fat people eat more bacon than skinny people? • Does B.O. significantly decrease attractiveness? • Do kids who get “hooked on phonics” have more problems with addiction later in life • Do people who study more do better on tests?
Frequency Distributions • Definitions • The values taken on by a given variable • All the actual data points you obtained for a given variable • Most basic ways to look at study outcomes • Quantitative Examples: • The SAT scores for all Winthrop students • The reaction times for all study participants • Grades on the first test: #’s of As, Bs, Cs, & Ds • The starting salaries of graduates • Qualitative Examples: • Favorite TV shows of students in this class • Residence halls occupied by students in this class
Representing Frequency Distributions • Table: • List possible values, and indicate the number of times each value occurred. • Graphs • X-axis: possible values • Y-axis: # of times that value occured
Graphing Distributions • Quantitative Data • Line graphs or Histograms (columns touching) • Qualitative Data • Pie charts & Bar graphs (columns not touching) • See SPSS Guide for examples • Also, you can practice with these datasets on the website… • city sprawl • bogus winthrop data • employee data
A Graph of the Normal Curve • Hypothetical Frequency Distribution (Line Graph) • Shows distribution of infinitely large sample (theoretical) • Symmetrical • Shows common and uncommon (extreme) scores • Basis for testing hypotheses • Percentiles Population SAT Scores μ = 500
Normal Curve (with raw and standard scores) μ Few Extreme Scores Few Extreme Scores
Deviations from Normality • Ways in which distribution can be non-normal • Skew • Positive Skew • Negative Skew • Kurtosis • Platykurtic • Mesokurtic • Leptokurtic • Modality • Unimodal • Bimodal (etc.)
Graphing Sample Means • One IV: Typically use bar-graph • Two IV: Typically use line-graph
Math Review • Preparation for Calculating Standard Deviation • Learn the differences between… • Σx • Σx2 • (Σx)2
Descriptive Statistics • Measures of Central Tendency • Where does the center of the distribution fall? • Where are most of the scores • Measures of Variability • How spread out is the distribution? • How dispersed are the scores? • Importance: • To determine whether IV affects DV, we consider: • The difference between the means • The amount of variability
Imaginary Study with 2 Outcomes • Purpose: See why variability is important • Research Question: • Imagine a business where customers are routinely offended: • comments about their mothers • misc. name calling • Does social skills training for clerks improve customer satisfaction scores. • IV: Social Skills training (training, no training) • DV: Customer Satisfaction • Imagine two worlds where we get two different outcomes
Version 1 Version 2 Training Study Outcomes
Data: # of close friends Note: Use “frequencies” in SPSS Mean arithmetic mean: all scores divided by “n” Sample: xbar or M Population: μ (“mu”) most arithmetically sophisticated best predictor if no other info available used in deviation score calculation M = 4.36 Median Score at 50th percentile – middle score less influenced by skew Md = 4 Mode most frequent score used with qualitative data Mo = 3 Measures of Central Tendency
Data: # of close friends What’s best for A? What’s best for B? What’s best for C? Choosing Measures of Central Tendency
SPSS Frequencies Output (partial) • Note: Need to select mean, median, & mode
Measures of Variability • What is Variability? • dispersion; spread; distance between scores • “Some people did really well, some did really poorly” • “My tips are always about the same, between $30 and $35” • “Some students study only a few minutes a day, some put in 30 hours per week.” • Range • simplest measure • High Score – Low Score • Problems: • only uses two scores – not good for summarize entire distribution • unduly affected by extreme scores
The Big Daddy: Standard Deviation • Standard Deviation • The typical deviation of a score from the mean of the distribution • Most scores (68%) fall between +1 and –1 SD. • Four Steps to Standard Deviation • 1. Deviation Score • 2. Sum of Squares • 3. Variance • 4. Standard Deviation
1. Deviation Scores • idea: • consider deviation of every score and add up • distance from mean of a given score: x – xbar • positive/negative deviation scores fall to the ____ of the mean • problem • why can’t we just add up the deviation scores • consider distribution of : 1, 2, 3
2. Sum of Squares (SS) • Means “Sum of the Squared Deviation Scores” • Square each score, then add up • Conceptual Formula (how we think about it) • Computational Formula (how we calculate by hand) Sum of x Quantity Squared Sum of x Squared • Problem • Biased by sample size – bigger samples have bigger SS
3. Variance • Sum of Squares – no control for size of sample • Think of relation between sumand average – divide sumby n • … with sum of sq.and variance – divide sum of sq. by n • Variance: • Average of the Squared Deviation Scores
4. Standard Deviation • Want measure in metric of raw scores • Remember?? We used Sum of the SQUARED Deviations • So…we take the square root of the variance • Note, subscript “x” is optional note that σ is no longer squared
How high should the bridge be? Truck Height: 7,6,8,5,6,5,6,7 average: 6.25 Can we build it 6.25? SD: Bridge Building Example • Calculation Tip: • Think anal retentive!!
So we’d expect the truck height to range between about 6.25 .9682 Roughly 5.25 to 7.25. But… What if we missed some extremely tall trucks??? Should actually calculate ŝ – Standard Deviation as a population estimate SD: Bridge Building II
SD: Typical Formula • Standard Deviation as a Population Parameter • SD as a Population Parameter Estimate • corrects for bias of smaller samples – missing of extreme scores
So… σ = 0.9682 ŝ = 1.0351 SD calculated as estimate will always be larger. SD: Bridge Building Revisited
What type of Standard Deviation? • A manager wants to know the variability in shift productivity for planning future projects. • A teacher calculates the variability of reading scores for just her class of 25 students, and only applies it to her sample. • The Educational Testing Service calculates the variability among SAT scores for all the students that took the SAT. • A researcher determines the variability in reaction time in a perception study. • Your statistics professor calculates test score variability with 25 students to know how much variability to expect on that sort of test. • A researcher on anxiety collects data from 1000 participants in order to develop norms for a new anxiety instrument.