1 / 10

- Finding the Confidence Intervals when σ Is Known or s Is a Good Estimate of σ

- Finding the Confidence Intervals when σ Is Known or s Is a Good Estimate of σ. 예 ) (a) 면적의 50% : -0.67 σ ∼ +0.67 σ (b) 면적의 80% : -1.28 σ ∼ +1.28 σ (c) 면적의 90% : -1.64 σ ∼ +1.64 σ 예 ) 결과값 x 와 표준편차 σ 를 갖는 data (from Fig. c)

Download Presentation

- Finding the Confidence Intervals when σ Is Known or s Is a Good Estimate of σ

An Image/Link below is provided (as is) to download presentation Download Policy: Content on the Website is provided to you AS IS for your information and personal use and may not be sold / licensed / shared on other websites without getting consent from its author. Content is provided to you AS IS for your information and personal use only. Download presentation by click this link. While downloading, if for some reason you are not able to download a presentation, the publisher may have deleted the file from their server. During download, if you can't get a presentation, the file might be deleted by the publisher.

E N D

Presentation Transcript


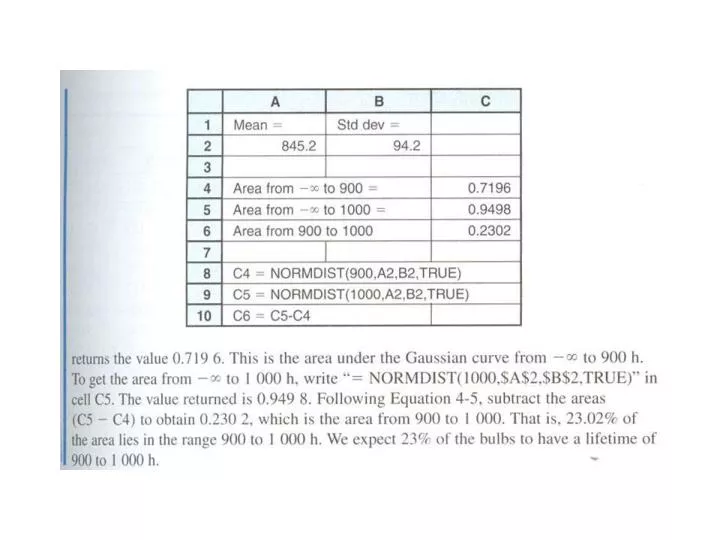
  1. - Finding the Confidence Intervals when σ Is Known or s Is a Good Estimate of σ 예) (a) 면적의 50% : -0.67σ ∼ +0.67σ (b) 면적의 80% : -1.28σ ∼ +1.28σ (c) 면적의 90% : -1.64σ ∼ +1.64σ 예) 결과값 x와 표준편차 σ를 갖는 data (from Fig. c) →100번 중 90번의 확률로 x±1.64 σ범위에true mean μ이 존재 →confidence level = 90% →confidence interval = -1.64σ ∼ +1.64σ

  2. For a the experimental mean with N measurements x For a single measurement x ⇒ 4번 측정시 (N=4)→CI 반으로 줄어 듬 일반적으로 2 ∼ 4번 횟수 평균 함 ⇒Bias가 없고, s →σ일 때 적용

  3. 4.3 Comparison of Means with Student’s t

More Related