
Optimizing Chlorophyll Retrievals Using Bio-Optical Algorithms for Water Quality Assessment
This study presents a framework for selecting and blending chlorophyll retrievals from bio-optical algorithms based on remote sensing reflectance in lakes and coastal waters. The diverse optical characteristics of these water types necessitate a classification system for optimal algorithm application. We identify optical water types, evaluate chlorophyll algorithms for each, and develop a blended approach that integrates these retrievals into a seamless product. The results demonstrate significant improvements in performance when algorithms are appropriately selected and blended, enhancing water quality assessment accuracy.

Optimizing Chlorophyll Retrievals Using Bio-Optical Algorithms for Water Quality Assessment
E N D
Presentation Transcript
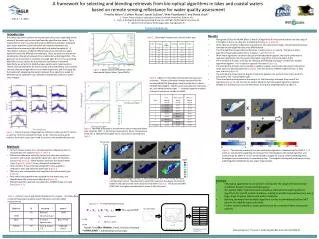
Chi-square PDF A framework for selecting and blending retrievals from bio-optical algorithms in lakes and coastal waters based on remote sensing reflectance for water quality assessment Timothy Moore1, Colleen Mouw2, James Sullivan3, Mike Twardowski3, and Shane Bradt1 1 - Ocean Process Analysis Laboratory, University of New Hampshire, Durham, NH 2 - Dept. of Geological & Mining Engineering & Sciences, Michigan Technological University, MI 3 – Western Environmental Technologies Labs, Narragansett, RI timothy.moore@unh.edu Rrs observation June 2 – 5, 2013 Z2 = (Vrs - yj)tj -1(Vrs - yj) Vrs – satellite pixel vector yj – jth class mean vector j– jth class covariance matrix mi, Si Introduction Bio-optical algorithms perform to varying levels of accuracy depending on the nature of the water environment and how the algorithm was tuned. This is especially true when considering the optical differences between traditional open ocean algorithms (low chlorophyll and optical complexity) and coastal/lake environments (high chlorophyll and optical complexity). A classification system is needed to differentiate when and where to apply algorithms tuned for different environments. Here, we present a scheme for blending the chlorophyll retrievals from multiple bio-optical algorithms. The goal was not to advocate or promote any single algorithm, but to use existing algorithms as case studies for the proposed classification framework. Specifically, we aimed 1) to identify unique optical water types based on remote sensing reflectance for turbid coastal and inland waters; 2) to evaluate the best chlorophyll algorithm for each water type found, and 3) to apply the full method of integrating chlorophyll retrievals from algorithms suited for different optical conditions into a blended and seamless product on ocean color imagery. • Results • Blue/green (OC4) and red/NIR (Meris 3-Band) Chl algorithms do not perform evenly over the range of chlorophyll in the in situ data (0.1 to 1000 mg/m3) (Figure 2, Table 3). • When data are sorted by reflectance characteristics into optical water types, chlorophyll performance between the two algorithms becomes differentiated. • The OC4 algorithm shows better performance in water types 1, 2, 3 and 6. The Meris 3-band algorithm shows better performance in types 4, 5 and 7 (Table 3). • When these algorithms are chosen by type and blended back together, the overall performance improves significantly over the whole chlorophyll range (from 0.47 and 0.446 to 0.30). • The membership function is the key for selecting and blending chlorophyll results from multiple algorithms together. This is based on spectral reflectance (Figure 2). • The membership function can be applied to satellite imagery, and membership maps to the optical water types can be generated (see Example). This was done for a MERIS image from Sep. 3, 2011 over Lake Erie (Figure 4). • The membership maps show the degree of similarity between the spectral ocean color vector for each pixel to the 7 optical water types. • These membership maps become the weights for the chlorophyll retrievals from each of the algorithms (Figure 5), and can then be used to blend the two chlorophyll algorithms together. • Weights are normalized to sum of memberships, forcing the weighting factors to add to 1. Membership Function Table 2. Chlorophyll characteristics of each water type. Result: A number between 0 and 1 that is a measure of the vector’s membership to that class. Figure 2. Mean spectral reflectance of the 7 lake/coastal Optical Water Types (OWTs). Table 3. RMS error of modeled chlorophyll and measured chlorphyll. The two chlorophyll models evaluated for the standard NASA OC4 (blue/green ratio) and the Meris 3-band (red/NIR band height). Statistics were calculated on entire data set, and individual water types. * - indicates negative modeled chlorophyll values not included in RMSE. Figure 3. Modeled chlorophyll a concentration versus measured values color-coded by OWT. A: OC4 versus measured; B: Meris 3-band versus measured; C: Blended chlorophyll versus measured as selected from Table 3. Figure 1. Cluster analysis of hyperspectral reflectance data revealed 7 clusters as optimal. Red lines indicate the mean vector. Means and covariance matrices from each cluster were used to construct the membership function. Membership 1 • Methods • Perform cluster analysis of in situ hyperspectral reflectance data to separate data into subsets (Figure 1, Table 1). • Reflectance data were sorted by cluster, and mean and covariance matrix for each cluster calculated to generate a fuzzy membership function (Equation 1). These statistics represent the Optical Water Types (Figure 2). Table 2 shows chlorophyll distributions. • OC4 and Meris 3-band chlorophyll algorithm were applied to reflectance data, and sorted by water type (Figure 3). • RMS error was calculated for each algorithm and optical water type (Table 3). • Best performing algorithm was assigned for that water type, and blended back into a continuous algorithm (Figure 3). • Blended algorithm approach was applied to a MERIS image over Lake Erie (Figure 4, 5). Figure 5. The blending scheme for the two chlorophyll algorithms. Memberships for OWTs 1, 2 ,3 and 6 are combined for weighting the retrieval from the blue/green chlorophyll algorithm, and memberships for OWTs 4, 5 and 7 are combined to weight the output of the red/NIR algorithm. All weights are normalized to the membership sum. The weighted chlorophyll products are simply added together (blended) into one single image product. 0.5 0 • Summary • Chlorophyll algorithms do not perform evenly over the range of environmental conditions found in coastal and lake waters. • The OpticalWater Type framework provides a mechanism to select preferred algorithms for specific optical conditions, leading to overall improved accuracy over a large range of typical lake/coastal water conditions. • Blending retrievals from multiple algorithms can be accommodated by the OWT scheme for satellite ocean color data. • Further study is needed to assess performance for a variety of lakes and coastal systems. Figure 4. A MERIS image from Sep. 3, 2011 classified to the 7 OWTs using the fuzzy membership function. Membership to each OWT represent the degree of similarity between the pixel and the mean vector for that OWT (Figure 2). The dominant OWT (OWT with the highest membership) is shown in the last panel. Table 1. Data set sources and station distribution for analysis. All station data contained hyperspectral above-water reflectance and chlorophyll measurements. Equation 1. The Membership Function *membership sum not required to = 1. Acknowledgment: This work is funded by NIH/NSF Grant R01 ES021929-02.


