Download
1 / 61
610 likes | 747 Views
When Good Crystallography Goes Bad: The Active Site Structure of Mo Enzymes. Graham N. George Department of Geological Sciences, University of Saskatchewan. Overview. Introduction to X-ray Absorption Spectroscopy Introduction to Molybdenum Enzymes

E N D
When Good Crystallography Goes Bad: The Active Site Structure of Mo Enzymes Graham N. George Department of Geological Sciences, University of Saskatchewan. Graham N. George
Overview • Introduction to X-ray Absorption Spectroscopy • Introduction to Molybdenum Enzymes • The Active Site Structure of DMSO Reductase • Recent work Graham N. George
What is X-ray Absorption Spectroscopy? sample Ion chamber detector Ion chamber detector I0 I1 E Absorbance = loge(I0/I1) Experiment: Scan the X-ray energy while monitoring the X-ray absorption. This can only be done using a synchrotron X-ray source. Graham N. George
X-ray Absorption Spectroscopy – Basic Physics Auger electron Emitted photo-electron continuum 2p 2s h h fluorescent photon 1s Graham N. George
X-ray absorption spectroscopy is element-specific K-edge XAS of some first transition elements. Graham N. George
XAS – Experimental Setup. Setup includes a liquid He cryostat and 30 element Ge detector array. Protein sample showing image of beam (X-ray induced color centers). Graham N. George
What is X-ray Absorption Spectroscopy? Emitted photo-electron continuum h 1s transitions to bound-states near-edge Just enough energy to eject core-electron (low energy photo-electron results). core-electron easily ejected (high energy photo-electron) EXAFS oscillations E Insufficient energy to eject core-electron Graham N. George
X-ray Absorption Spectroscopy EXAFS oscillations (k3-weighted) Near-edge spectrum Graham N. George
X-ray Absorption Spectroscopy – Basic Physics Auger electron Emitted photo-electron continuum 2p 2s h h fluorescent photon 1s Graham N. George
EXAFS – Basic Physics Photo-electron DeBroglie wave. E E Bromine atom Br2 molecule Schematics diagrams of final state wave functions. Graham N. George
X-ray Absorption Spectroscopy The EXAFS Fourier Transform EXAFS oscillations (k3-weighted) Fourier transform Graham N. George
X-ray Absorption Spectroscopy The EXAFS Fourier Transform EXAFS oscillations (k3-weighted) Phase-corrected Fourier transform Graham N. George
X-ray Absorption Spectroscopy The EXAFS Fourier Transform Mo-S S Mo [MoS4]2- Graham N. George
X-ray Absorption Spectroscopy The EXAFS Fourier Transform Mo-S S Cl Mo Fe Mo····Fe [MoS4FeCl2]2- [MoS4]2- Graham N. George
Near-edge Spectra – Excitation to bound states 2- 2- selenate elemental Se selenite Se-methionine Graham N. George
X-ray Absorption Spectroscopy • Examines all of a particular element in a sample • No sample pre-treatment required (don’t need crystals etc.) • Near edge spectrum – gives information on electronic structure (oxidation state etc.) • EXAFS (Extended X-ray Absorption Spectroscopy) oscillations in X-ray absorption Gives a Radial Structure. Graham N. George
Strengths and Limitations of EXAFS Structural parameters that are available from EXAFS analysis: • Average bond-lengths, R • Coordination Numbers, N • Debye-Waller factors, σ2 σ2 is the mean-square displacement of the bond-length from the average value R. It has components from atomic vibration and disorder, and can be thought of as being similar to a crystallographic temperature factor. It differs from the temperature factor in that it is due to relative displacement of atoms. • Geometric information is generally unavailable, although multiple scattering sometimes allows bond-angle determination. • Data analysis is not always a routine matter. Graham N. George
Strengths and Limitations of EXAFS The Debye-Waller factor is not a total unknown The Debye-Waller is a sum of static disorder and vibrational components. σ2 = σ2stat. + σ2vib. σ2vib. – can be computed accurately for a given bond-length (using force constants derived from vibrational spectroscopy or density functional theory). σ2stat. – upper and lower limits for this can be computedfrom the k-range of the data and the coordination number. 2 Mo-S at ~ 2.4 Å 0.0063 Å2 > σ2 > 0.0020 Å2 2 Mo-O at ~ 2.0 Å 0.0068 Å2 > σ2 > 0.0025 Å2 Graham N. George
EXAFS vs. Crystallography Expt. Calc. Mo-S Mo=O • Comparison with small molecule X-ray crystal structures – • Use crystallographic bond-lengths and coordination numbers • Refine Debye-Waller factors σ2within reasonable bounds • There is excellent agreement between the two techniques • σ2 values match well with ab-initio calculated values (e.g. for Mo=O 0.0018(2)vs. 0.0017 Å2). Graham N. George
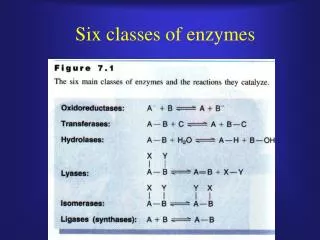
Molybdenum Enzymes • All molybdenum enzymes contain an organic cofactor. • This is called “molybdopterin”. • Almost all catalyze two-electron redox reactions involving oxygen transfer between Mo and substrate. • Either one or two molybdopterin cofactors can be coordinated to the metal via the dithiolene linkage. Graham N. George
DMSO reductase Mo4+ Mo6+ Catalyses the two-electron reduction of dimethylsulfoxide (DMSO) to dimethylsulfide (DMS). Mo is oxidized from Mo4+ to Mo6+ formal oxidation state in the process. 2H+ H2O + + DMSO DMS The Prototypical member of the DMSO reductase family of Mo enzymes. The best studied DMSO reductases are those of Rhodobacter capsulatus and Rhodobacter sphaeroides. These have nearly identical sequences and properties. Graham N. George
Structural studies of DMSO reductase active site 7 February 1996 - first EXAFS 14 June 1996 - first crystallography 18 October 1996 - more crystallography 15 September 1997 - some more crystallography 1 December 1997 - still more crystallography 30 January 1998 - even more crystallography 30 January 1998 - more EXAFS (a different group) 27 November 1998 - crystallography of a closely related enzyme 17 February 1999 - more EXAFS 16 August 2000 - yet more crystallography Prior to the 1999 EXAFS study there was a lot of confusion and debate about the active site structure. To some extent the debate still continues. Graham N. George
First EXAFS of DMSO reductase 7 February 1996 “X-ray Absorption Spectroscopy of Dimethyl Sulfoxide Reductase from Rhodobacter sphaeroides” G. N. George, J. Hilton and K. V. Rajagopalan J. Am. Chem. Soc. 1996, 118(5), 1113-1117 Graham N. George
First EXAFS of DMSO reductase 7 February 1996 “X-ray Absorption Spectroscopy of Dimethyl Sulfoxide Reductase from Rhodobacter sphaeroides” G. N. George, J. Hilton and K. V. Rajagopalan J. Am. Chem. Soc. 1996, 118(5), 1113-1117 • Mono-oxo Mo6+ and des-oxo Mo4+ • Four Mo-S indicated two cofactors • Postulated oxo-transfer mechanism • Suggested that one cofactor might dissociate. • “It seems likely that the active site can adopt at least two different structures” Graham N. George
First Crystallography of DMSO reductase 14 June 1996 “Crystal Structure of DMSO Reductase: Redox-Linked Changes in Molybdopterin Coordination” H. Schindelin, C. Kisker, J. Hilton, K. V. Rajagopalan and D. C. Rees Science, 1996, 272 1615-1621 Gave us our first look at the 3-dimensional structure of the protein. Graham N. George
First Crystallography of DMSO reductase 14 June 1996 “Crystal Structure of DMSO Reductase: Redox-Linked Changes in Molybdopterin Coordination” H. Schindelin, C. Kisker, J. Hilton, K. V. Rajagopalan and D. C. Rees Science, 1996, 272 1615-1621 Ser147 Ser147 Mo6+ Mo4+ mono-oxo Mo6+ des-oxo Mo4+ Big changes in Mo coordination on changing metal oxidation state! Graham N. George
Proposed Catalytic Mechanism Graham N. George
More crystallographic results followed… 18 October 1996 “Crystal Structure of Dimethyl Sulfoxide Reductase from Rhodobacter capsulatus at 1.88 Å Resolution” F. Schneider, J. Löwe, R. Huber, H. Schindelin, C. Kisker and J. Knäblein J. Mol. Biol. 1996 263, 53-69 The structure was different! – a dioxo Mo6+ site with only one of two cofactors bound. Graham N. George
And more crystallography followed those … 1 December 1997 “Molybdenum active centre of DMSO reductase from Rhodobacter capsulatus: crystal structure of the oxidised enzyme at 1.82-Å resolution and the dithionite-reduced enzyme at 2.8-Å resolution” A. S. McAlpine, A. G. McEwan, A. L. Shaw and S. Bailey JBIC, 1997, 2, 690-701 di-oxo Mo6+ mono-oxo Mo4+ The structures were different again! Graham N. George
Even more crystallography followed … Oxidized Mo6+ + DMS (gray-green) DMSO-bound form (pink purple) 30 January 1998 “The High Resolution Crystal Structure of DMSO Reductase in Complex with DMSO” A. S. McAlpine, A. G. McEwan and S. Bailey J. Mol. Biol. 1998, 275, 613-623 This work found that if the product (DMS) is added to oxidized enzyme then a pink-purple species was formed which had DMSO bound to the active site. This DMSO-bound form was studied by X-ray crystallography. Graham N. George
Even more crystallography followed … 30 January 1998 “The High Resolution Crystal Structure of DMSO Reductase in Complex with DMSO” A. S. McAlpine, A. G. McEwan and S. Bailey J. Mol. Biol. 1998, 275, 613-623 A seven-coordinate mono-oxo molybdenum site, with DMSO covalently bound with an unusually long S=O bond length (1.7 Å). Graham N. George
Lots of different structures for the same active site... Mo6+ Mo6+ Mo4+ DMSO Mo6+ Mo4+ Mo4+ All protein folds were essentially identical Graham N. George
And then more EXAFS followed … 30 January 1998 “X-ray absorption spectroscopy of dimethylsulfoxide reductase from Rhodobacter capsulatus” P. E. Baugh, C. D. Garner, J. M. Charnock, D. Collison, E. S. Davies, A. S. McAlpine, S. Bailey, I. Lane, G. R. Hanson and A. G. McEwan JBIC, 1998, 2, 634-643. The conclusions of this study totally supported the crystal structures of Bailey and co-workers… And another mechanism was postulated… Graham N. George
EXAFS vs. protein crystallography DMSO Exptl. Calc. Mo4+ • Comparison with protein X-ray crystal structures – • Use crystallographic bond-lengths and coordination numbers • Refine Debye-Waller factors σ2within reasonable bounds The crystal structure does not agree with our EXAFS data. Graham N. George
EXAFS vs. small molecule crystallography Expt. Calc. Mo-S Mo=O • Comparison with small molecule X-ray crystal structures – • Use crystallographic bond-lengths and coordination numbers • Refine Debye-Waller factors σ2within reasonable bounds • There is excellent agreement between the two techniques • σ2 values match well with ab-initio calculated values (e.g. for Mo=O 0.0018(2)vs. 0.0017 Å2). Graham N. George
EXAFS vs. protein crystallography Mo6+ Mo6+ Mo4+ DMSO Mo6+ Mo4+ Mo4+ None of the crystal structures fitted our EXAFS data… Graham N. George
Resonance Raman does agree with our EXAFS data 31 December 1997 “Active Site Structures and Catalytic Mechanism of Rhodobacter sphaeroides Dimethyl Sulfoxide Reductase as Revealed by Resonance Raman Spectroscopy” S. D. Garton, J. Hilton, H. Oku, B. R. Crouse, K. V. Rajagopalan and M. K. Johnson J. Am. Chem. Soc. 1997, 119, 12906-12916 • Resonance Raman spectroscopy indicated a mono-oxo Mo6+ species for the oxidized enzyme • Both Mo=O and Mo-S frequencies agreed quantitatively with our EXAFS-derived bond-lengths Graham N. George
The first structure was unusual… Caltech Rees group, oxidized form More than one half of the metal coordination sphere is empty! Graham N. George
The other crystal structures were odd too… Caltech Rees group, reduced form • A 3-coordinate Mo4+ site – a totally unknown coordination • Mo-O-C bond angle close to 180º • More than ½ the metal coordination sphere totally empty Graham N. George
The other crystal structures were odd too… Martinsried Huber group, oxidized form The O=Mo=O bond angle is impossibly small. Graham N. George
The other crystal structures were odd too… Daresbury Bailey group, oxidized form • Many supposedly non-bonded atoms with overlapping Van der Waals radii • O=Mo=O bond-angle impossibly small (70º) Graham N. George
The other crystal structures were odd too… Daresbury Bailey group, oxidized form • Too many atoms, not enough room. • Overlapping Van der Waals radii with non-bonded atoms – the Mo6+ structure showed six of these. • All the other Bailey structures had the same problem. • So did crystal structures of related enzymes (TMAO reductase). Graham N. George
Were all of the structures wrong? On close inspection ALL of the structures had some chemically implausible or impossible features. Impossibly crowded atoms Impossibly acute or unlikely bond-angles Unusual bond-lengths (this is expected) We concluded that ALL crystal structures were either wrong or had major problems. We re-examined all the EXAFS (several times), including the DMSO bound form. We examined the EXAFS of other closely related Mo enzymes (biotinsulfoxide reductase, trimethylamineoxide reductase). They looked just like DMSO reductase. Graham N. George
But what about the other EXAFS? The experimental data of Baugh et al. looks the same as ours – so why did they form such very different conclusions? – Physically impossible Debye-Waller factors. Some of the σ2 values used by Baugh et. al. were so big that they effectively removed the EXAFS. Baugh et al. started from the crystal structure coordinates, then (probably) refined σ2 values with no boundaries imposed, and finally refined bond-lengths etc. to obtain their final result. This gave conclusions that were heavily biased towards the crystal structure. “X-ray absorption spectroscopy of dimethylsulfoxide reductase from Rhodobacter capsulatus” P. E. Baugh, C. D. Garner, J. M. Charnock, D. Collison, E. S. Davies, A. S. McAlpine, S. Bailey, I. Lane, G. R. Hanson and A. G. McEwan JBIC, 1998, 2, 634-643. Graham N. George
But what about the other EXAFS? DMSO-bound form: A total of 9 components with 18 variables were refined. “X-ray absorption spectroscopy of dimethylsulfoxide reductase from Rhodobacter capsulatus” P. E. Baugh, C. D. Garner, J. M. Charnock, D. Collison, E. S. Davies, A. S. McAlpine, S. Bailey, I. Lane, G. R. Hanson and A. G. McEwan JBIC, 1998, 2, 634-643. Graham N. George
But what about the other EXAFS? Too big Too big Too big Too big Too big Some of the σ2 values were impossibly big. This reduces the EXAFS intensity of these components “X-ray absorption spectroscopy of dimethylsulfoxide reductase from Rhodobacter capsulatus” P. E. Baugh, C. D. Garner, J. M. Charnock, D. Collison, E. S. Davies, A. S. McAlpine, S. Bailey, I. Lane, G. R. Hanson and A. G. McEwan JBIC, 1998, 2, 634-643. Graham N. George
But what about the other EXAFS? Too big Too small Too big Too big Too small Too big Too big Too small Too small Other σ2 values were impossibly small. This increases the EXAFS intensity of these components “X-ray absorption spectroscopy of dimethylsulfoxide reductase from Rhodobacter capsulatus” P. E. Baugh, C. D. Garner, J. M. Charnock, D. Collison, E. S. Davies, A. S. McAlpine, S. Bailey, I. Lane, G. R. Hanson and A. G. McEwan JBIC, 1998, 2, 634-643. Graham N. George
But what about the other EXAFS? Too big Too small Too big Too big Too small Too big Too big Too small Too small Ignore the very low intensity components in the fit, and those which cancel “X-ray absorption spectroscopy of dimethylsulfoxide reductase from Rhodobacter capsulatus” P. E. Baugh, C. D. Garner, J. M. Charnock, D. Collison, E. S. Davies, A. S. McAlpine, S. Bailey, I. Lane, G. R. Hanson and A. G. McEwan JBIC, 1998, 2, 634-643. Graham N. George
But what about the other EXAFS? Too big Too small Too big Too big Too small Too big Too big Too small Too small “X-ray absorption spectroscopy of dimethylsulfoxide reductase from Rhodobacter capsulatus” P. E. Baugh, C. D. Garner, J. M. Charnock, D. Collison, E. S. Davies, A. S. McAlpine, S. Bailey, I. Lane, G. R. Hanson and A. G. McEwan JBIC, 1998, 2, 634-643. Graham N. George
EXAFS and EPR spectroscopy 17 February 1999 “Structure of the Molybdenum Site of Dimethyl Sulfoxide Reductase” G. N. George, J. Hilton, C. Temple, R. C. Prince and K. V. Rajagopalan J. Am. Chem. Soc. 1997, 121, 1256-1266. • This paper suggested that the conclusions of all of the crystallographic studies and the Daresbury EXAFS study were wrong. • The structural conclusions presented in this work were essentially the same as in our original 1996 paper. • We suggested that multiple species might be present in the crystals and that this caused erroneous conclusions. Graham N. George