Download
1 / 25
250 likes | 405 Views
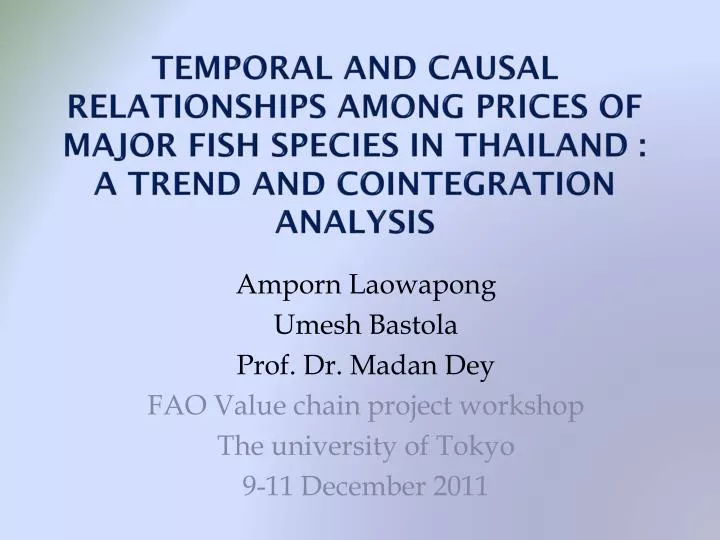
temporal and causal relationships among prices of major fish species in Thailand : A trend and cointegration analysis. Amporn Laowapong Umesh Bastola Prof. Dr. Madan Dey FAO Value chain project workshop The university of Tokyo 9-11 December 2011. Presentation Outline. Background

E N D
temporal and causal relationships among prices of major fish species in Thailand : A trend and cointegration analysis AmpornLaowapong UmeshBastola Prof. Dr. MadanDey FAO Value chain project workshop The university of Tokyo 9-11 December 2011
Presentation Outline • Background • Objectives • Data • Trend analysis in prices and margins • Econometric analysis • Summary and Conclusion
Background • Thailand aquaculture / fisheries Total production = 3.78 million tons (140 B Baht, 4.7 B USD) Source: Laowapong, 2010
Background…. • Export-Import Situation (2009) • Export • 1.88 million tons • 224.5 B Baht • 35% of total food export • Shrimp 38% • Canned tuna 24% • Import • 1.59 million tons • 68.5 B Baht • 35% of total food import • Tuna 52% • Fresh/chilled 38% Source: Laowapong, 2010
Fish species studied • Seabass (Latescalcifer): Marine; pond; cages; domestic; 10% processed • Hybrid walking catfish (Clariussp.): Freshwater; pond (98%); smoked (20%); canned (10%) • Black tilapia: Freshwater; pond (83%); cages (14%). • Tuna: Thai vessels; imports; canned; exported (90%) • Vannamei Shrimp (Penaeusvanamei): Coastal; export • Black tiger shrimp (P. monodon)
Objectives • To examine trends and seasonality in prices of different species at different levels of supply chain. • To assess extent of gross margin of wholesaler and retailers of different fish species, and check the variability in margins due to season. • To explore the causal relationships among price series of various fish species at different levels of supply chain.
Trend in prices Catfish Seabass Tuna Tilapia
Gross Margins • Wholesale level • Retailer level • Four species: • Seabass • Catfish • Tilapia • Vinnamei shrimp
Granger Causality test *denotes null hypothesis rejected at 5%. ** denotes null hypothesis rejected at 1%.
Cointegrationtest *MacKinnon-Haug-Michelis (1999) p-values
Cointegrating Equations ln BR = 1.3692 ln TR………………….(i) ln ST = 0.8106 ln CT………………….(ii) ln V40 = 1.0322 ln V50………………(iii) ln V50 = 0.9688 ln V40………………(iv)
Vector Error Correction Model Long-term adjustment Short-term adjustment
Conclusion • Catfish and tilapia prices are found to be relatively stable over time whereas other price series show comparatively more fluctuations. • Price series at various levels of supply chain and those of different product types of same species are found to move in a similar fashion. • Prices series such as seabass farm and retail, tilapia farm and wholesale and skipjack tuna prices reveal some seasonal variation. • More explicit in shrimp prices, generally lower from May to December and higher in other months.
Conclusion • Gross margins were lower at wholesale levels than at retail levels for all species except tilapia. • The average wholesale gross margins ranged from 7% to 51% and that at retail level ranged from 21% to 59%. • In case of seabass, the average percent margins were lower at both wholesale and retail markets. • Market power of retailers higher than that of wholesalers? • In general, no any specific seasonality in gross margin.
Conclusions • Unidirectional Granger causality is found in TR and CT price, bi-directional Granger causality between V40 and V50. • One cointegrating equation between each pairs of series. • The statistically significant terms in VECM showed that 13 to 54 % of deviations were adjusted in the short-run. • TR and BR as well as CT and ST are found to move in opposite direction while that of shrimp of sizes 40 pcs/kg and 50 pcs/kg are found to move in similar direction.