Download
1 / 51
510 likes | 669 Views
Economics 105: Statistics. GH 19 not due Tue. Pretest. Program. Posttest. O. X. O. Regression Threat. Group is a nonrandom subgroup of population. For example, mostly low literacy kids will appear to improve because of regression to the mean. Example: height. Regression to the Mean.

E N D
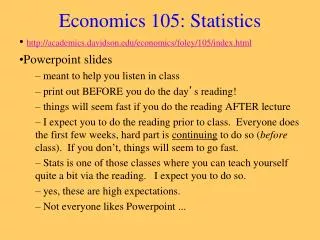
Economics 105: Statistics GH 19 not due Tue
Pretest Program Posttest O X O Regression Threat • Group is a nonrandom subgroup of population. • For example, mostly low literacy kids will appear to improve because of regression to the mean. • Example: height
Regression to the Mean pre-test scores ~ N When you select a sample from the low end of a distribution ... Selected group’s mean Overall mean the group will do better on a subsequent measure. post-test scores ~ N & assuming no effect of treatment pgm The group mean on the first measure appears to “regress toward the mean” of the population. Overall mean Regression to the mean
Sir Francis Galton (1822 – 1911) 903 adult children & their 250 parents Regression to the Mean
Regression to the Mean • How to Reduce the effects of RTM (Barnett, et al., International Journal of Epidemiology, 2005) • When designing the study, randomly assign subjects to treatment and control (placebo) groups. Then effects of RTM on responses should be same across groups. • Select subjects based on multiple measurements • RTM increases with larger variance (see graphs) so subjects can be selected using the average of 2 or more baseline measurements.
The Central Issue • When you move from single to multiple group research the big concern is whether the groups are comparable. • Usually this has to do with how you assign units (e.g., persons) to the groups (or select them into groups). • We call this issue selection or selection bias.
O X O O O The Multiple Group Case Alternative explanations Measure baseline Administer program Measure outcomes Do not administer program Measure baseline Measure outcomes Alternative explanations
Example • Diabetes education for adolescents • Pre-post comparison group design • Measures (O) are standardized tests of diabetes knowledge
O X O O O Selection-History Threat • Any other event that occurs between pretest and posttest that the groups experience differently. • For example, kids in one group pick up more diabetes concepts because they watch a special show on Oprah related to diabetes.
O X O O O Selection-Maturation Threat • Differential rates of normal growth between pretest and posttest for the groups. • They are learning at different rates, even without program.
O X O O O Selection-Testing Threat • Differential effect on the posttest of taking the pretest. • The test may have “primed” the kids differently in each group or they may have learned differentially from the test, not the program.
O X O O O Selection-Instrumentation Threat • Any differential change in the test used for each group from pretest and posttest • For example, change due to different forms of test being given differentially to each group, not due to program
O X O O O Selection-Mortality Threat • Differential nonrandom dropout between pretest and posttest. • For example, kids drop out of the study at different rates for each group. • Differential attrition
O X O O O Selection-Regression Threat • Different rates of regression to the mean because groups differ in extremity. • For example, program kids are disproportionately lower scorers and consequently have greater regression to the mean.
What Are “Social” Threats? • All are related to social pressures in the research context, which can lead to posttest differences that are not directly caused by the treatment itself. • Most of these can be minimized by isolating the two groups from each other, but this leads to other problems (for example, hard to randomly assign and then isolate, or may reduce generalizability).
What Are “Social” Threats? • Diffusion or imitation of Treatment • Compensatory Equalization of Treatment • Compensatory Rivalry • Resentful Demoralization
What is a Clinical Trial? • “A prospective study comparing the effect and value of intervention(s) against a control in human beings.” • Prospective means “over time”; vs. retrospective • It is attempting to change the natural course of a disease • It is NOT a study of people who are on drug X versus people who are not • http://www.clinicaltrials.gov/info/resources
Example: Job Corps • What is Job Corps? http://jobcorps.doleta.gov/ • January 5, 2006 Thursday Late Edition – Final SECTION: Section C; Column 1; Business/Financial Desk; ECONOMIC SCENE; Pg. 3HEADLINE: New (and Sometimes Conflicting) Data on the Value to Society of the Job CorpsBYLINE: By Alan B. Krueger. Alan B. Krueger is the Bendheim professor of economics and public affairs at Princeton University. His Web site is www.krueger.princeton.edu. He delivered the 2005 Cornelson Lecture in the Department of Economics here at Davidson (that’s the big econ lecture each year).
Example: Job Corps • Quotations from “New (and Sometimes Conflicting) Data on the Value to Society of the Job Corps” by Alan B. Krueger. • Since 1993, Mathematica Policy Research Inc. has evaluated the performance of the Job Corps for the Department of Labor. • Its evaluation is based on one of the most rigorous research designs ever used for a government program. From late 1994 to December 1995, some 9,409 applicants to the Job Corps were randomly selected to be admitted to the program and another 6,000 were randomly selected for a control group that was excluded from the Job Corps. • Those admitted to the program had a lower crime rate, higher literacy scores and higher earnings than the control group.
RCT for Credit Card Offers A1: 0% APR for first 8 months & 9.99% on balance transfers, then 9.99% on purchases A2: 0% APR for first 12 months, & 9.99% on balance transfers, then 9.99% on purchases A3: 0% APR for first 8 months & 8.99% on balance transfers, then 8.99% on purchases Source: Agarwal, et al. (2010), Journal of Money, Credit & Banking, 42 (4)
RCT for Education in India Source: Banerjee, et al. (2007), Quarterly Journal of Economics
RCT for the Effect of High Rewards on Performance Source: Ariely, Gneezy, Loewenstein, and Mazar (2009), Review of Economic Studies
RCT for the Effect of High Rewards on Performance Random assignment !
Recommended Reading Amazon link Amazon link Amazon link
Introduction to Regression Analysis • Correlation analysis only measures the strength of the association (linear relationship) between two variables … not necessarily a causal relationship • Regression analysis is used to: • Predict the value of a dependent variable based on the value of at least one independent variable • Explain the impact of changes in an independent variable on the dependent variable • Dependent variable: the variable we wish to predict or explain variation in ... outcome variable, Y. • Independent variables: the variables used to explain variation in Y ... covariates, explanatory variables, r.h.s. vars, X-variables
Types of Relationships Linear relationships Curvilinear relationships Y Y X X Y Y X X
Types of Relationships (continued) Strong relationships Weak relationships Y Y X X Y Y X X
Types of Relationships (continued) No relationship Y X Y X
a b • Theoretical Model: • b0andb1are constant terms • b0 is the intercept • b1 is the slope • Xi is a predictor of Yi Deterministic Linear Models Yi b0 Xi
Stochastic Simple Linear Population Regression Model (continued) Y Observed Value of Y for Xi εi Pop Slope = β1 Pop Random Error for this Xi value Pop Intercept = β0 X Xi
Y E[Y|X] = 0+ 1X X Gauss-Markov Assumptions (1) Zero conditional mean Idiosyncratic, “white noise” Measurement error on Y Omitted relevant explanatory variables … why? (2) Homoskedastic errors (3) No serial correlation among errors (autocorrelation)
Gauss-Markov Assumptions (4) Linear in the parameters + error Variation in Y is caused by , the error (as well as X) Not (5) Random sample of data are i.i.d. (Ancillary) errors are normally distributed
Stochastic Linear Models Assumptions so far imply Need to estimate population intercept & slope Take a sample of data & obtain the sample regression line
Sample Regression Equation(Prediction Line) The sample regression line equation provides an estimate of the population regression line Estimated (or predicted) Y value for observation i Estimate of the regression intercept Estimate of the regression slope Value of X for observation i Other notation: The individual random error terms ei have a mean of zero
Sample Regression Equation chosen in sample not chosen in sample Y estimated error for X3 (residual) Observed Value of Y for X3 e3 ε3 Predicted Value of Y for X3 X X3
Sample Regression Equation Y Residual, ei, is the prediction error Positive errors Negative errors X
Derivation of OLS Estimators Select to minimize SSE Set first partial derivatives = 0 Results are
The effect of X on Y (from regressing “Y on X”) Interpretation of OLS Parameters • Sample regression function is • For one-unit change in X, the average value of Y changes by units • intercept ?
OLS calculations “by hand” File is in P:\Economics\Eco 105 (Statistics)\lec_simple reg.xls