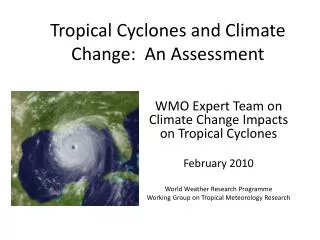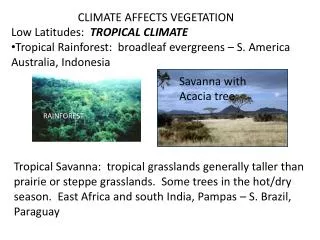
Tropical Climate
Tropical Climate. Tropical Climates are dominated by. The tropical Hadley Cell! This drives Trade Winds Sinking Dry Air Creating Deserts Monsoons Varies with the movement of the ITCZ. Negative (blue) values represent rising air; positive (red) values indicate sinking air.

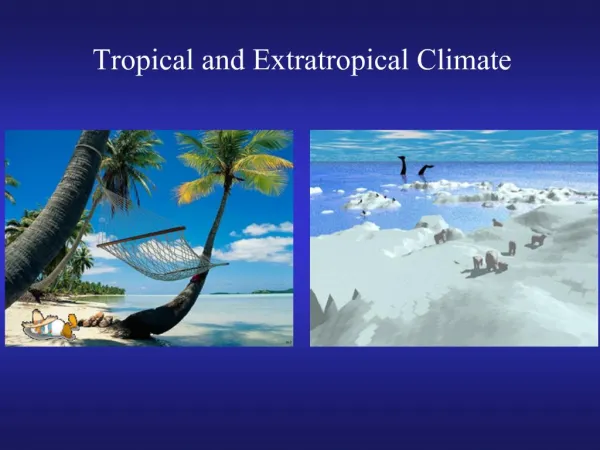
Tropical Climate
E N D
Presentation Transcript
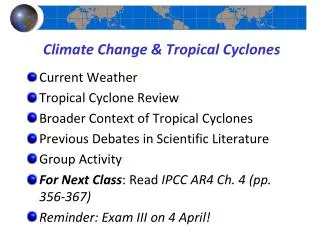
Tropical Climates are dominated by • The tropical Hadley Cell! • This drives • Trade Winds • Sinking Dry Air Creating Deserts • Monsoons • Varies with the movement of the ITCZ
Negative (blue) values represent rising air; positive (red) values indicate sinking air.
Wet Equatorial Climate • Moist climate of the equatorial zone • 10°N to 10°S • Large annual water surplus • Warm temps all year • Dominated by ITCZ • mE & mT air masses • Annual rainfall can exceed 2500 mm Iquitos, Peru, 9°S
Trade-wind Coastal Climate • Moist, low-latitude climate • Rainfall peak in high-sun season • Short dry period in low-sun season • East side of continents • 5-25°N & S • Warm all year Belize City, Belize, 17°N
Wet-Dry Tropical Climate Timbo, Guinea 10°N • Located 5-30°N & S • Each year very wet & very dry season • High-sun season → ITCZ influence → Wet • Low-sun season → STH influence → Dry • Wet season → mT & mE air • Dry season → cT air • Drought-resistant plants
Monsoon Coastal Climate • Coastal South Asia • Wet high-sun season • Asiatic low • Dry low-sun season • Siberian high • Small temp range
Dry Tropical Climate • Tropical zones – 15-25° N & S • High temps / low rainfall • Sinking air • Adiabatic warming • Little cloud cover • Large daily temp range Wadi Halfa, Sudan, 22°N
Dry Subtropical Climate • Poleward extension of Dry Tropical climate • Similar heat to Dry Tropical in high-sun season • Larger annual temp range • Cooler low-sun season • Lower sun angle • Shorter days • Arid & semi-arid subtypes • Mostly cT air masses • Some cP in low-sun season Yuma, AZ, 33°N
Moist Subtropical Climate • East side of continents 25-35°N & S • Moist mT air from STH • Water surplus • Large annual temp range • Some cP air in winter • Winter precip common from midlatitude cyclones Charleston, SC, 33°N
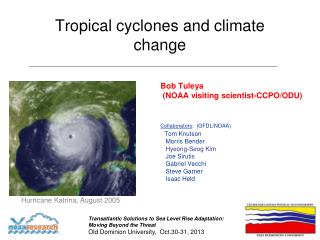
Tropical Cyclone Structure • Most Powerful, Destructive Cyclonic Storms • Western Hemisphere → Hurricane • Western Pacific → Typhoon • Indian Ocean → Cyclone • Develop from easterly waves 10-20°N & S • Grow from tropical depressions, weak cyclones • Next step is tropical storms (35-74 mph winds) • Sustained winds ≥ 74 mph → Tropical Cyclone
Requirements for Tropical Cyclone Development • Warm water (>26.5 °C) • The right adiabatic lapse rate (6.5 °C/km) • Mid-level moisture • Coriolis Force (minimum distance of 500 Km from the equator) to initiate rotation
Requirements for Tropical Cyclone Development • A “seed” low level disturbance (tropical wave) • Lack of vertical wind shear • Favorable steering currents
The tropics heat up MUCH more than the poles. Especially the South Atlantic and the Gulf • Hurricanes are parasites on warm water….it is the fuel for their growth. • The summer sun drops about 5000 watts of energy on a square meter per day in the tropics. • The tropical oceans absorb and STORE solar energy in the form of heated water.
A gallon of aviation gas has about 1.4 x 10⁸ Joules of energy. • A Joule is energy expended (or work done) in applying a force of one newton through a distance of one meter • Calorie: the energy needed to increase the temperature of 1 gram of water by 1 °C. This is about 4.2 joules • In a week the sun puts about that much energy into a square meter of the tropics. • The Sun essentially makes the tropics into a high-octane fuel source for Hurricanes.
Where you don’t get Tropical Cyclone Development • Middle latitudes: Water is too cold, westerly winds produce too much shear • Near the equator: Not enough Coriolis Force • South Atlantic: Cool water, wind shear, and lack of tropical waves from the ITCZ • Mediterranean: Sometimes get tropical-like systems, but generally the sea is too small • Great Lakes?
The Physics of Hurricanes • What drives hurricanes is latent heat from water evaporation and water condensation. • Water releases 2257 kJoules/kilo (2.3 x 10⁶J/kg) on condensation • A cyclone will cycle ~1014 kilos of water a day or about 100 billion tons….. • A fraction of this heat is converted into mechanical energy that drives wind speed • Mostly goes into updrafts which increase cloud height and speed up condensation, releasing more energy • In a day a cyclone releases ~200 x 1018 J • 720 megatons of TNT • 70 times world energy consumption
Tropical Cyclone Cross Section • Extremely low pressure/Strong pressure gradient • Intense convergence & uplift → Heavy rainfall • Latent heat release provides energy
Positive Feedback in a Tropical Cyclone • Easterly wave initiates convection • Low pressure forms at surface • Warm, moist air spirals inward from ocean • Air rises, expands, cools, and condenses • Condensation release latent heat into storm • Warmer air rises faster • Faster rising air drives inward spiral of air • And so on…
Most tropical cyclones form at 10–20°N or S • Follow cyclone tracks west turning to northeast • Tropical cyclones fade in cool westerlies • None in South Atlantic or SE Pacific
Tropical Cyclone Hazards • Wind Damage – some produce wind gusts >200 mph • Fresh Water Flooding – can extend far inland • Earthflows – due to heavy rainfall & saturated soil • Storm Surge – most serious – can inundate coast • due to low pressure and high winds
The Physics of Hurricane Damage • Work or Energy = ½ mass x velocity2 =1/2 mv2 • This is the energy in a moving object…..and it scales by the square of velocity! • Take wind…..the energy deposited by 1 kilo of air • Cat 1 (40 m/s) = ½ x 1kg x (40m/s)2 = 800 J • Cat 3 (55 m/s) = ½ x 1kg x (55m/s)2 = 1512 J • Cat 3 (80 m/s) = ½ x 1kg x (80m/s)2 = 3200 J • A factor of 4 increase in energy from doubling the wind speed.
Storm Surge • Waves are worse since water is denser so carries more kinetic energy per unit volume. • Take a modest wave, say 3 meters, hitting a house…. • Mass ~ 200,000 kg • Velocity = 3 m/s • Energy ~ 900,000 joules • About the same as driving a truck into the house at 50 mph.
Heat driving atmospheric banding and storms is not unique to Earth. • The banding on Jupiter (and the other gas-giant planets) is caused by the same process. • In this picture the rising atmosphere is light, the sinking is dark. The knothole-looking things are essentially hurricanes.
The “Red Spot” on Jupiter is a hurricane that has lasted at least 400 years. • It was first seen by Galileo using the first astronomical telescope.
Cyclical Patterns of Atlantic Hurricanes • 1970-1994 was down time for Atlantic storms • Since 1995: • Warmer water off east coast of US • On average, more hurricanes each year • On average, more major hurricanes each year • 2005 was record year with 28 storms • Likely due to cycle in thermohaline circulation • Next 20 years likely continued high hurricane activity