Download

1 / 43
430 likes | 559 Views
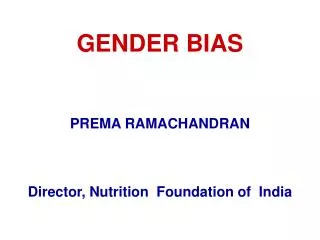
GENDER BIAS PREMA RAMACHANDRAN Director, Nutrition Foundation of India. IS THERE ANY EVIDENCE OF GENDER BIAS FROM People’s Perception Demographic Indices Health Care & Indices Nutrition Indices. Are there any policies& programmes to reduce consequences of gender bias

E N D
GENDER BIAS PREMA RAMACHANDRAN Director, Nutrition Foundation of India
IS THERE ANY EVIDENCE OF GENDER BIAS FROM • People’s Perception • Demographic Indices • Health Care & Indices • Nutrition Indices
Are there any policies& programmes to reduce consequences of gender bias • Advocacy/legislation • Programme interventions in • Maternal and child health • Nutrition
GENDER BIAS - IMPACT ON SEX RATIO&0-6 SEX RATIO • Time trends • Interstate& inter district variations • Interventionsto arrest & reverse the trend
The changes till 1971 are mainly due to higher longevity among men; in 2001 women’s longevity is slightly greater than men’s
Urban sex ratio is lower partly due to urban migration of men
SexRatio Less than 900 Total No. of Districts (excl J & K) in 1991: 452 Number of Districts: 143 or 31.6% districts District Map indicating sex ratio (census 2001)
2001 Census Data Child Sex Ratio in the Age Group 0 – 6 (1981 to 2001)
Haryana Child sex ratio (District) 1991 2001
Child Sex Ratio 2001 Gujarat by Tahsils
Child Sex Ratio 2001 Tamil Nadu by Tahsils
Sex Ratio at Birth : Rajasthan 2001 2000
Ongoing Interventions • PNDT Act • Female infanticide is a cognizable offence • Universal registration of all pregnant women • Antenatal care and Counseling • Advocacy for institutional delivery • Universal registration of births and deaths to identify problem areas for focussed intervention
Amniocentesis – No longer commonly used Ultrasonography – Diagnosis of sex possible in II trimester by visualising the genitalia Chorion Villous – Diagnosis in I trimester biopsy expensive, has risks spontaneous abortion Pre-conceptional – Developing technology sex selection individual’s choice
PNDT Act can therefore be an enabling tool for achieving social transformation. • It can be used as an educational tool to build up awareness among the population. • The deterrent punitive measures may reduce abuse of the technology by the clinics for sex selective abortion. • However only when the population mind set is changed can manifestations of the gender bias, like female infanticide and sex selective abortions, be eliminated.
Mean Energy Consumption- Children / Adolescents and Adults Age Group Males Females Kcals RDI % RDI Kcals RDI % RDI Pre-school 889 1357 65.5 897 1351 66.4 School Age 1464 1929 75.9 1409 1876 75.1 Adolescents 2065 2441 84.6 1670 1823 91.6 Adults 2226 2425 91.8 1923 1874 102.6 Source NNMB
Anaemia among Adolescents girls age 10-19 years in INDIA 5 Percent 28 Percent 24 Percent 43 Percent
EFFECT OF INCREASE IN LONGEVITY • women live longer • more women than men in over 65 years • mostly housewives; no assured income • poor family support • poor health care • unneeded; not looked after. • Current Need: Better care for these women who cared for others as long as they could