Download
1 / 1
10 likes | 164 Views
Genetic evaluation of mobility for Brown Swiss dairy cattle G. R. Wiggans 1 , J. R. Wright* 1 , C. J. Muenzenberger 2 , and R. R. Neitzel 2 1 Animal Improvement Programs Laboratory, Agricultural Research Service, USDA, Beltsville, MD 20705-2350

E N D
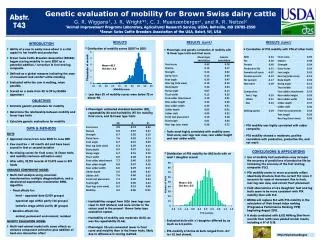
Genetic evaluation of mobility for Brown Swiss dairy cattle G. R. Wiggans1, J. R. Wright*1, C. J. Muenzenberger2, and R. R. Neitzel2 1Animal Improvement Programs Laboratory, Agricultural Research Service, USDA, Beltsville, MD 20705-2350 2Brown Swiss Cattle Breeders Association of the USA, Beloit, WI, USA Abstr. T43 2012 INTRODUCTION • Ability of a cow to easily move about is a vital aspect to her health and production • Brown Swiss Cattle Breeders Association (BSCBA) began scoring mobility in June 2007 as a potential addition / correction to foot and leg composite • Defined as a global measure indicating the ease of movement and comfort while standing • Evaluated while the cow is walking, when possible • Scored on a scale from 50 to 99 by BSCBA appraisers RESULTS RESULTS (cont.) RESULTS (cont.) • Phenotypic and genetic correlation of mobility with 16 linear type traits and final score • Distribution of mobility scores (2007 to 2011) • Correlation of PTA mobility with PTA of other traits Thousandsof records Mean=83.7 Std dev=4.3 Mobilityscore • Less than 5% of mobility scores were below 75 or above 90. OBJECTIVES • Estimate genetic parameters for mobility • Determine the relationship between mobility and linear type traits • Calculate genetic evaluations for mobility • Phenotypic estimated standard deviation (SD), repeatability (R) and heritability (h2) for mobility, final score, and 16 linear type traits • PTA mobility was highly correlated with udder composite. • PTA mobility showed a moderate, positive correlation with production, productive life, and net merit. • DATA & METHODS • EDITS: • Appraisal scores from June 2007 to June 2011 • Cow must be < 69 month old and have been scored in first or second lactation • No missing scores for final score, 16 linear traits, and mobility (variance estimation only) • After edits, 32,710 records of 19,472 cows in 819 herds • VARIANCE COMPONENT MODEL: • Multi-trait analysis using canonical transformation, multiple diagonalization, and a decelerated expectation-maximation REML algorithm • Fixed effects for: • herd – appraisal date (2,109 groups) • appraisal age within parity (46 groups) • lactation stage within parity (21 groups) • Random effects for: • animal, permanent environment, residual • GENETIC EVALUATION MODEL: • Multi-trait animal model with same effects as variance component estimation plus addition of herd-sire interaction effect • Traits most highly correlated with mobility were final score, rear legs rear view, rear udder height and rear udder width. CONCLUSIONS & APPLICATIONS • Use of mobility trait evaluations may increase the accuracy of predictions of productive life by increasing the accuracy of the foot and leg composite (FLC). • PTA mobility seems to more accurately reflect ideal body structure than the current FLC since it accounts for ease of movement, flex to hock, rear leg rear view, and correct thurl placement. • Field observations of sire daughters’ feet and leg traits seem to be more consistent with PTA mobility than with FLC. • BSCBA will replace FLC with PTA mobility in the calculation of their breed index ranking (Progressive Performance Ranking; PPR) beginning August 2012. • A study conducted with 6,152 Milking Shorthorn records from 4,213 cows yielded similar results, including a h2 of 0.18. • Distribution of PTA mobility for 840 bulls with at least 1 daughter scored Mean=0.0 Std dev=0.5 Number of bulls • Heritabilities ranged from 0.06 (rear legs rear view) to 0.37 (stature) and were similar to the values used in the present Brown Swiss type evaluation system. • Heritability of mobility was moderate (0.21), as was the repeatability (0.46). • Phenotypic SD was somewhat lower in final score and mobility than in the linear traits, likely due to difference in scoring method. PTA mobility • Evaluated bulls with ≥1 daughter differed by as much as 3.4 points. • PTA mobility of Active AI bulls ranged from -0.7 to+1.2 (not shown). http://aipl.arsusda.gov