Renewable Energy Finance Basics
320 likes | 552 Views
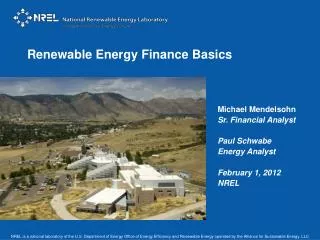
Renewable Energy Finance Basics. Michael Mendelsohn Sr. Financial Analyst Paul Schwabe Energy Analyst February 1, 2012 NREL. Agenda. NREL Finance Team Financing Background Project Financial Structures Financial Modeling Metrics. NREL Finance Team. RE Project Finance Team – overview.

Renewable Energy Finance Basics
E N D
Presentation Transcript
Renewable Energy Finance Basics Michael Mendelsohn Sr. Financial Analyst Paul Schwabe Energy Analyst February 1, 2012 NREL NREL is a national laboratory of the U.S. Department of Energy Office of Energy Efficiency and Renewable Energy operated by the Alliance for Sustainable Energy, LLC
Agenda • NREL Finance Team • Financing Background • Project Financial Structures • Financial Modeling Metrics National Renewable Energy Laboratory Innovation for Our Energy Future
NREL Finance Team National Renewable Energy Laboratory Innovation for Our Energy Future
DATA: RE Finance Tracking Initiative (REFTI) REFTI collects and disseminates wide array of project and financial info including cost of tax equity and LCOE
CREST Models: Solar, Wind, Geo • Primary: Levelized Cost of Energy (LCOE), Yr. 1 Cost of Energy • Secondary: Rolled up and Detailed Cash Flows
Visualization - RE Project Finance Website http://financeRE.nrel.gov http://financeRE.nrel.gov • Feature Analyses: Unique NREL analysis about policies, innovations and market conditions that impact RE project financing User Login: registered users can comment, rate content • Flexible Search: by keyword, or by filters (single/multi-) by sector, tech, size, policy, financing structure, and/or content type • Blog Analyses: Credible, objective policy and market observations from NREL analysts NATIONAL RENEWABLE ENERGY LABORATORY
Financing Background National Renewable Energy Laboratory Innovation for Our Energy Future
Key Metrics • Levelized Cost of Energy (LCOE) {or Levelized Cost per Mile (LCPM)} • = Discounted sum of costs / Discounted sum of energy produced {or miles driven} • Return on Equity (ROE) • = Discounted sum of returns to investor / initial investment • Internal Rate of Return (IRR) • = Discount rate necessary to make returns to investor equal $0 • Weighted Average Cost of Capital (WACC) • = A calculation of a firm’s cost of capital in which each category of capital (e.g. debt and equity) is proportionally weighted • Payback • = number of years of benefits to recover initial investment National Renewable Energy Laboratory Innovation for Our Energy Future
Project IRR impact on LCOE Lower risk = lower required return = lower LCOE Every 1% reduction in target equity IRR results in $4/MWh for wind and $8/MWh for PV Source: Deutsche Bank Climate Change Advisors, “Get Fit Plus: Derisking Clean Energy Business Models in a Developing Country Context “ National Renewable Energy Laboratory Innovation for Our Energy Future
Sources of Investment Capital National Renewable Energy Laboratory Innovation for Our Energy Future
Financing Risk Factors National Renewable Energy Laboratory Innovation for Our Energy Future
Financing Risk Factors, cont’d National Renewable Energy Laboratory Innovation for Our Energy Future
U.S. Federal Tax Incentives & Tax Equity National Renewable Energy Laboratory Innovation for Our Energy Future
Tax Incentives Designed to Spur RE Investment • Two Primary Federal Incentives Available: • Investment Tax Credit (ITC) / Production Tax Credit (PTC) • Accelerated Depreciation • Together, ITC/PTC and accelerated depreciation count for approx. 50-55% of a project’s capital investment National Renewable Energy Laboratory Innovation for Our Energy Future
Tax Incentives: Only Good if You Can Use Them • Renewable energy projects and their developers don’t have sufficient taxable income (aka “tax appetite”) to utilize fully • Without sufficient tax appetite, the tax incentives have to be “carried forward” • Greatly reduces the present value of the tax incentives, and thus their ability to induce investment • Credits and depreciation must be claimed by the owner • Benefits are nonrefundable and non-transferable
Simplified Financial Structure Representation Corporate Parent Project Company Power, RECs, Tax Ben. 2)Equity Partnership 3)Equity Partnership With Debt • 1)Single Developer / Investor Senior Lender Developer Tax Investor / Govt. Developer Tax Investor / Govt. Project Company Project Company Power, RECs, Tax Ben. Power, RECs, Tax Ben. National Renewable Energy Laboratory Innovation for Our Energy Future
Commonly Used Financial Structures • Partnership Flip (PF) structures • All Equity PF • Cash and tax benefits allocated to tax investor (primarily) until TI receives pre-defined IRR (flip point). After, allocations flip from TI to developer • Leveraged PF • Similar to AEPF but debt at project level increases required yield by tax investor by approx. 2%, often alters allocation schedule • 2. Lease structures • Sale Leaseback • Developer sells project to an entity (lessor) who then leases it back to the developer to operate and garner revenue • Inverted lease (a.k.a. lease pass-through) • ITCs passed via Master Lease; Tenant operates equipment and makes lease payments to Owner (not simulated in SAM) • 3. Single-owner (balance sheet) National Renewable Energy Laboratory Innovation for Our Energy Future
Leveraged Partnership Flip Senior Lender Developer (1% of equity) Tax Investor (99% of equity) Project Company (equity + PPA/cash debt) Tax incentives can lead to complicated financial structures Power (and REC) Sales Federal Incentive ITC/Cash Grant Cash Revenue 1% / 0% 99% / 100% less Operating Expenses less Tax-Deductible Expenses (including MACRS and interest on debt) less Debt Service equals Taxable Losses/Income (which result in Tax Benefits/Liabilities) equals Distributable Cash 1% / 90% 99% / 10% 1% / 90% 99% / 10%
Detailed Financial Structures in SAM • Four Financial Structures Recently Added to SAM • All Equity Partnership Flip • Leveraged Partnership Flip • Sale Leaseback • Corporate (Single Owner) • Allows For: • More realistic evaluation of RE costs • Information transfer from finance and legal RE experts to and new industry participants • National lab analytic capability • Examination of complex support • policies National Renewable Energy Laboratory Innovation for Our Energy Future
Financial Modeling Metrics: Capital Recovery Factor and Fixed Charge Rate National Renewable Energy Laboratory Innovation for Our Energy Future
The FCR method is one of many standard approaches used to represent finance in LCOE equations • FCR equation is a representation of a cash-flow model and determines the amount of revenue needed to cover investment and operating cost. • Defined as the amount of revenue per dollar of investment that must be collected annually to pay the carrying charges on that investment as well as taxes FCR equation, as we generally present it, combines a standard amortization equation (Capital Recovery Factor) and an equation that accounts for the additional revenue required to meet tax obligations. This method was adopted by all program areas during the EPRI/DOE Technology Characterization from 1995/996 and the wind program has used it ever since d(1+d)n 1- (T*PVdep) (1+d)n - 1 (1-T) Capital Recovery Factor Value of Taxes and Depreciation Fixed Charge Rate
The use of different Fixed Chare Rates can result in LCOEs that measure different cost aspects • FCR calls for an after-tax discount rate (d) and can be either nominal or real (depending on discount rate input). WACC method generally used to estimate d • Fixed Charge rates can represent different scenarios: • No-tax Investment Scenario: • Cost After Tax Deductions Scenario: • Before Tax Revenue Required Scenario: d(1+d)n d(1+d)n d(1+d)n 1- (T*PVdep) (1+d)n - 1 (1+d)n - 1 (1+d)n - 1 Determines cost of energy that will allow investor to recover costs and achieve target ROR without considering tax obligations (1-T) FCR Determines after-tax cost of energy that will allow investor to recover costs and achieve target ROR assuming full monetization of tax benefits FCR [1- (T*PVdep)] Determines before-tax cost of energy that will allow investor to recover costs, meet tax payments, and achieve target ROR FCR
Thank you Michael Mendelsohn Paul Schwabe National Renewable Energy Laboratory Innovation for Our Energy Future
Extra Slides National Renewable Energy Laboratory Innovation for Our Energy Future
Tax Equity a Critical Component to RE Financing • To take advantage of tax incentives, often a separate investor with tax appetite is brought into the project • Generally referred to as “tax equity” • Currently very small pool of tax equity investors (investment banks, insurance companies known as institutional investors) • Continued tax appetite required (MACRS 6 year recovery period) • Complexity of the project structure • Wide array of risks perceived: • Technology • Developer • Off-taker (utility or commercial entity) credit rating and contract duration • Regulatory (e.g., can regulators alter the PPA contract?) • Site access
Wind Project Development Process • Entire process can take 3-4 years to reach operational phase • Pick any two: “Fast, cheap, or good” Source: Holland & Hart, RE Project Development & Finance
Risk Factor Mitigants National Renewable Energy Laboratory Innovation for Our Energy Future
Project IRR impact on LCOE How do we de-risk projects in order to lower required return? Deutsche Bank calls it TLC:* How do different policies impact financing and transaction costs? * Source: Deutsche Bank Climate Change Advisors, “Get Fit Plus: Derisking Clean Energy Business Models in a Developing Country Context “ National Renewable Energy Laboratory Innovation for Our Energy Future
U.S. Wind Investment in Response to Policy National Renewable Energy Laboratory Innovation for Our Energy Future
Feed-In Tariff Design Considerations National Renewable Energy Laboratory Innovation for Our Energy Future