Download
1 / 35
370 likes | 601 Views
Plant Growth and Development Table of Contents. Date Lesson 5: How Does Your Plant Grow? (Day 5, 6, 7, or 8).

E N D
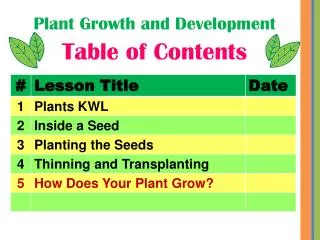
Plant Growth and Development Table of Contents
DateLesson 5: How Does Your Plant Grow? (Day 5, 6, 7, or 8) At this stage of the growing cycle (approximately Day 5, 6, or 7—possibly 8), the plants have grown tall enough for students to measure and record their height in centimeters on a graph. This is an opportunity for students to apply graphing skills to the experiences they are having growing plants.
For each student: Student notebook 1 quad of plants 1 sheet of centimeter graph paper (see Appendix F of teacher’s guide) 1 strip of paper precut to 1 centimeter wide (see Appendix F of teacher’s guide) 1 pair of scissors Materials List For the class: • 1 bag of 500 snap-together centimeter cubes • Glue • Crayons
Students complete this weekly. Same day every week.
Wisconsin Fast Plants Growth Graph • Glue the Wisconsin Fast Plants Growth Graph into your notebooks. (TH-7) • Choose one plant to measure for the rest of this unit. • Move your name label to that cell of your quad to mark the plant you have chosen. • Write the age of the plant in the appropriate place and measure.
Measuring with paper strips… • Mark the height of the plant by drawing a line on the strip. • Fill in the squares below that line. • Double-check by holding the paper up against the plant again. • Cut off the darkened squares and above the correct day number and glue it in place.
Measuring with centimeter cubes… • Fit the cubes together so you can measure your plant to the nearest centimeter. The bottom of the cube must rest upon either the potting mix or the rim of the quad. Always rest the cubes or paper strip on the same place when measuring your plant. • Lay the cubes on the graph above the correct day number and mark the height of the column. • Darken in the bar graph to that height.
In our training: Measure one plant in each quad. Week 1= Day # 7 Week 2= Day # 14 Week 3= Day # 21 7 28 14 21 35 42
Plant Growth and Development Table of Contents
Overview In addition to growing in height, plants also develop leaves and flower buds. In this lesson, students will observe the first true leaves and the buds on their Brassica plants and record their observations in both words and pictures. These developments will take place on approximately Day 7, 8, or 9.
Observe your quad of plants with a hand lens. Look for the following: • Differences between the seed leaves and the true leaves • Number of both kinds of leaves • Color, size, shape, and number of buds
Draw and label the plant in your Observation Sheet. Your drawing should show the following: • the age of your plant in days • the differences between the two kinds of leaves • the buds • the right number of leaves and buds
How old are the plants today?Our plants have changed a lot since Day 1. What was the first stage of the plant’s life cycle?
Life Cycle CardsAt about 24 hours after planting, the embryonic root emerges.
After about 28 hours, the seedling emerges from the potting mix. The seed coat is split and the white cotyledons or seed leaves are visible.
During Day 2 and 3, both the root system and the cotyledons, which are now green, continue to grow.
On Day 4 or 5, the first true leaves appear at the growing tip of the plant, between the seed leaves.
From Days 4 through 7, the true leaves continue to emerge and grow at a remarkably rapid pace.
By Day 8 or 9, the yellow-green flower buds appear in a tight cluster.
What do you think will happen to the plants next?Write your predictions in your notebook.
Plant Growth and Development Table of Contents
Lesson 7: Growth Spurt (Day 9) Question: What is a growth spurt? Students predict and measure their plants everyday beginning Day 9 to about Day 13.
Growth Graph Days 9 – 13 are the growth spurt days and dramatic changes happens. Record daily on Growth Spurt Chart. After day 18 there is very little growth in height. The plant is busy producing buds, flowers, and seeds. Measure at least once a week to confirm that growth has slowed or stopped. Record this on the Growth Graph.
Plant Growth and Development Table of Contents
Date Lesson 8:Why are Bees Important? BEES What We Know BEES What We Wonder
Plant Growth and Development Table of Contents
Participant’s Guide TH-9 Not necessary
Make a scientific drawing in your notebook. The Worker Bee
Foldable Smallest in size, but 90% of hive’s population Always a female Works herself to death- takes care of larvae, build and clean nest, collect nectar and pollen Lives 3-6 weeks Largest, only one in hive “Egg Factory”-can produce 1,500 eggs each day Lives 3-5 years Makes up about 10% or hive’s population Strong flier, male Purpose in life- to catch the queen during nuptial flight and fertilize her. Winner dies Lives 1-2 seasons (spring, summer, or both)
Self-Assess: Fill in the sheet without your notes. The Worker Bee