Download

1 / 56
560 likes | 681 Views
Are Americans Getting Sicker? Richard K. Thomas, Ph.D. University of Mississippi Applied Demography Conference January 9, 2014.

E N D
Are Americans Getting Sicker?Richard K. Thomas, Ph.D.University of MississippiApplied Demography ConferenceJanuary 9, 2014
Alternate TitleAn Examination of Trends in the Morbidity Status of the U.S. Population:A Comparative Analysis of 20th Century Morbidity Rates and 21st Century Morbidity Rates
A Century of Improving Health Status The 20th century characterized by: • A decline in overall mortality • A decline in infant and maternal mortality • Increasing life expectancy • The elimination of many common diseases
A Century of Improving Health Status:Infant and Maternal Mortality
Measuring Morbidity Change:Methodological Issues • Population to be considered • Morbidity measurement • Data availability • Other issues
Measuring Morbidity Change:Methodological Issues • Population to be considered • Total population • Relevant sub-groups • Adults • Children • Seniors • Only native-born citizens
Measuring Morbidity Change:Methodological Issues • Morbidity measurement • Global indicators • Aggregate indicators • Specific diseases • Relative importance
Measuring Morbidity Change:Methodological Issues • Data availability • No central repository of health data • Inconsistency of data collection • Completeness of data collection • Time period covered
Measuring Morbidity Change:Methodological Issues • Other issues • Data quality • Questionnaire consistency • Population/age range covered • Actual rates vs. reported rates
Measuring Morbidity Change:Methodological Issues • Determining trend direction • Trend reversal • Trend stagnation • Slowing rate of change • Comparative performance
Measuring Morbidity Change:Research Plan • Specifying desired indicators • Identifying available data • Selection of most appropriate/ complete data • Creating a patchwork quilt of various rates
Measuring Morbidity Change:Research Plan As is often the case in health demography: We do the analysis with the data we have…rather than the data we would like to have.
Measuring Morbidity Change:Research Plan Technical note: Intended to compare 1900-2000 period with 2000-2010 period Observed direction changes typically occurred in the 1990s
Measuring Morbidity Change:Findings Global indicators: • Self-reported health status • Mortality
Measuring Morbidity Change:Findings Self-reported health status Until the mid-1990s: • Steady increase in “very good” and “excellent” responses • Steady decrease in “fair” and “poor” responses
Measuring Morbidity Change:Findings Self-reported health status From the mid-1990s on: • Decline in “very good” and “excellent” responses • Increase in “fair” and “poor” responses
Measuring Morbidity Change:Findings Self-reported health status* • Reporting “very good” or “excellent” 1997 – 68.5% 2011 – 61.1% • Reporting “fair” or “poor” 1997 – 9.2% 2011 – 12.8% *Age-adjusted
Measuring Morbidity Change:Findings Self-reported health status • Decline essentially across all demographic categories • Some variation for specific subgroups • The young-old and middle-old were outliers
Measuring Morbidity Change:Findings Mortality trends • Continued overall decline (but leveling off) • Negative trends for some subgroups • Negative trends for some causes
Measuring Morbidity Change:Findings Mortality trends Negative trends for some subgroups • Poorly educated white women • Decline of 5 years life expectancy (1990-2008) • Poorly educated white men • Decline of 3 years life expectancy (1990-2008)
Measuring Morbidity Change:Findings Life expectancy trends: 1985-2010 U.S. women dropped from: • 14th place to 41st place among the world’s countries • Middle of the pack to dead last among developed countries
Measuring Morbidity Change:Findings Mortality trends • Increased rate for maternal mortality • From low of 0.7/100,000 to 2.1/ 100,000 (1987-2010)
Measuring Morbidity Change:Findings 1950 2010
Measuring Morbidity Change:Findings Aggregate indicators: Acute conditions: • General decline but fluctuating • Current rate – modern high
Measuring Morbidity Change:Findings Aggregate indicators: Chronic conditions: • Steady increase in population affected (1995-2010): 41.7% - 47.0% • Steady increase in the number per person
Measuring Morbidity Change:Findings Aggregate indicators: Disability • Increase in the proportion with disability • Increase in the proportion with multiple disabilities • Increased proportion of seniors requiring personal assistance requirements
Measuring Morbidity Change:Findings Aggregate indicators: Disability • Activity limitation: 11.8% - 28.7% (1970-2010) • Any disability: 27.0% - 30.3% (1997-2009)
Measuring Morbidity Change:Findings Increased incidence of selected notifiable diseases (1997-2011): • Mumps • Malaria • Legionnaire’s disease • Pertussis
Measuring Morbidity Change:Findings Persistence of selected notifiable diseases (2011): • Tuberculosis – 10,528 • Chickenpox – 14,513 • Coccidioidomycosis – 22,634 • Giardiasis – 16,747 • Salmonellosis – 51,887 • Shigellosis – 13,352
Measuring Morbidity Change:Findings On-going epidemic of sexually transmitted infections (2011): • Chlamydia – 1,412,791 • Gonorrhea– 321,849 • Syphilis – 46,042 • HIV – 35,266
Measuring Morbidity Change:Findings Mortality trends Negative trends for some causes • Increased mortality rates for: • Flu/pneumonia • Diabetes • Chronic lower respiratory diseases • Chronic liver disease/cirrhosis, Parkinson's disease • Pneumonitis
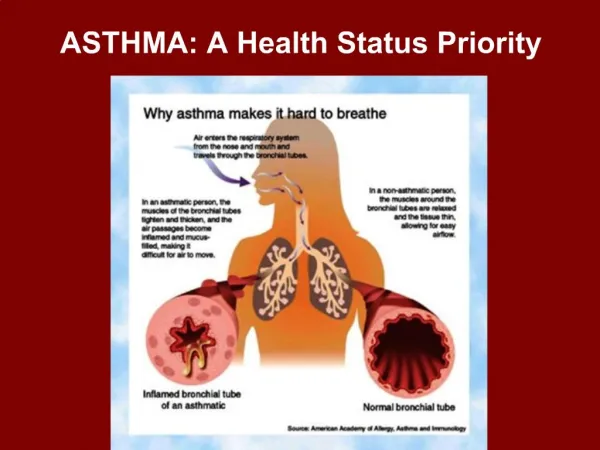
Measuring Morbidity Change:Findings Selected chronic diseases among adults (1979/81-2011): • HBP: 11.1% - 24.3% • CHD: 2.4% - 6.3% • Stroke: 0.9% - 2.6% • Cancer: 6.5% - 8.0% • Emphysema: 1.0% - 1.9% • Asthma: 3.1% - 8.1%
Measuring Morbidity Change:Findings • Provisional explanation: • U.S. population is older on average so we should expect a higher prevalence of chronic disease
Measuring Morbidity Change:Findings Increased prevalence of chronic diseases: 2001-2010 • Adults (45-64) with 2-3 – significant increase • Adults (45-64) with 4+ - significant increase • Adults (65+) with 2-3 – significant increase • Adults (65+) with 4+ – significant increase
Measuring Morbidity Change:Findings Increased prevalence of selected chronic diseases among older adults (45-64): 2008-2011 • High blood pressure • Diabetes • Asthma • Cancer • Depression
Measuring Morbidity Change:Findings Aggregate indicators of chronic disease among seniors: 19982008 1 or more 86.9% 92.2% 4 or more 11.7% 17.4%
Measuring Morbidity Change:Findings Child health indicators Significant increases in: • Physical health problems (especially chronic disease) • Mental health problems • Disability
Measuring Morbidity Change:Findings Child health indicators: Significant increases in: • Asthma • Other respiratory illnesses • Allergies • Hypertension • Other heart problems • Diabetes
Measuring Morbidity Change:Findings Child health indicators (ages 2-8): • Any chronic condition: • From 12.8% - 26.6% (1988-2006) • Obesity: • From 13.1% - 14.9% (1988-2010)
Measuring Morbidity Change:Findings Child health indicators: Mental health indicators: • Increases in: • Autism • ADHD • Other
Measuring Morbidity Change:Findings Child health indicators: • Disability indicators (1984-2004): • Activity limitation: 5.1% - 7.0% • Needs ADL help: 0.3% - 0.6% • Prematurity: 10.6% - 11.5%* *1990-2012