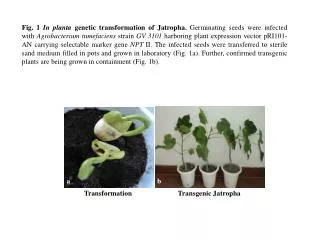
Phase Transformation
Phase Transformation. WHY STUDY Phase Transformations? . The development of a set of desirable mechanical characteristics for a material often results from a phase transformation that is wrought by a heat treatment.


Phase Transformation
E N D
Presentation Transcript
WHY STUDY Phase Transformations? • The development of a set of desirable mechanical characteristics for a material often results from a phase transformation that is wrought by a heat treatment. • It is important to know how to use these diagrams in order to design a heat treatment for some alloy that will yield the desired room-temperature mechanical properties. • For example, the tensile strength of an iron–carbon alloy of eutectoid composition (0.76 wt% C) can be varied between approximately 700 MPa (100,000 psi) and 2000 MPa (300,000 psi) depending on the heat treatment employed.
WHY STUDY Phase Transformations? • Heat treatments for metal alloys (as well as other materials) are designed on the basis of how temperature influences the rate at which phase transformations occur. • For iron–carbon alloys, the development of microstructural elements other than Pearlite are possible.
INTRODUCTION • One reason metallic materials are so versatile is that their mechanical properties (strength, hardness, ductility, etc.) are subject to control and management over relatively large ranges. • The development of microstructure in both single- and two-phase alloys ordinarily involves some type of phase transformation. • Inasmuch as most phase transformations do not occur instantaneously, consideration is given to the dependence of reaction progress on time, or the transformation rate.
Phase Transformations • Phase Transformations are divided into three classifications. • Simple diffusion-dependent transformations (Pure metal) • Diffusion-dependent transformation (The eutectoid transformation) • Diffusion less- (a martensitic transformation)
Microstructural and Property Changes in Iron–Carbon Alloys • To study Microstructural and Property Changes this system has been chosen because it is familiar and because a wide variety of microstructures and mechanical properties are possible for iron–carbon (or steel) alloys.
Isothermal Transformation Diagrams • For an iron–carbon alloy of eutectoid composition (0.76 wt% C), isothermal fraction reacted versus the logarithm of time for the austenite-to-Pearlite transformation.
Two solid curves are plotted; one represents the time required at each temperature for the initiation or start of the transformation; the other is for the transformation conclusion. • The dashed curve corresponds to 50% of transformation completion. • These curves were generated from a series of plots of the percentage transformation versus the logarithm of time taken over a range of temperatures. • In interpreting this diagram, note first that the eutectoid temperature [727˚C (1341˚F)] is indicated by a horizontal line; at temperatures above the eutectoid and for all times, only austenite will exist. The austenite-to-Pearlite transformation will occur only if an alloy is super cooled to below the eutectoid
Several constraints are imposed on using diagrams. First, this particular plot is valid only for an iron–carbon alloy of eutectoid composition; for other compositions, the curves will have different configurations. • In addition, these plots are accurate only for transformations in which the temperature of the alloy is held constant throughout the duration of the reaction. • Conditions of constant temperature are termed isothermal; thus, plots are referred to as isothermal transformation diagrams, or sometimes as time temperature transformation (or T–T–T) plots.
Bainite • In addition to Pearlite, other micro constituents that are products of the austenitic transformation exist; one of these is called Bainite. • The microstructure of bainite consists of ferrite and cementite phases. • Bainite forms as needles or plates, depending on the temperature of the transformation.
The isothermal transformation diagram for an iron–carbon alloy of eutectoid composition that has been extended to lower temperatures. • All three curves are C-shaped and have a “nose” at point N, where the rate of transformation is a maximum. • As may be noted, whereas Pearlite forms above the nose [i.e., over the temperature range of about 540 to 727˚C (1000 to 1341˚F)], at temperatures between about 215 and 540˚C (420 and 1000˚F), bainite is the transformation product.
Transmission electron micrograph showing the structure of bainite.
Martensite • Yet another microconstituent or phase called martensite is formed when austenitized iron–carbon alloys are rapidly cooled (or quenched) to a relatively low temperature. • Martensite is a no equilibrium single-phase structure that results from a diffusion less transformation of austenite. • The martensitic transformation occurs when the quenching rate is rapid enough to prevent carbon diffusion. • Any diffusion whatsoever will result in the formation of ferrite and cementite phases
Photomicrograph showing themartensitic microstructure. • The needle shaped grains are the martensite phase, and the white regions are austenite that failed to transform during the rapid quench.
The complete isothermal transformation diagram for an iron–carbon alloy of eutectoid composition • A-austenite • P-Pearlite. • B-bainite • M- martensite
Sample Heat Treatment (a) Rapidly cool to 350˚C, hold for 104s, and quench to room temperature. (b) Rapidly cool to 250 ˚C hold for 100 s, and quench to room temperature. (c) Rapidly cool to 650 ˚C, hold for 20 s, rapidly cool to 400˚C, hold for 103s, and quench to room temperature.
CONTINUOUS COOLING TRANSFORMATION (CCT) DIAGRAMS • Isothermal heat treatments are not the most practical to conduct because an alloy must be rapidly cooled to and maintained at an elevated temperature from a higher temperature above the eutectoid. • Most heat treatments for steels involve the continuous cooling of a specimen to room temperature. • An isothermal transformation diagram is valid only for conditions of constant temperature; this diagram must be modified for transformations that occur as the temperature is constantly changing. • For continuous cooling , the time required for a reaction to begin and end is delayed.
Superimposition of isothermal and continuous cooling transformation diagrams for a eutectoid iron–carbon alloy.
Moderately rapid and slow cooling curves superimposed on a continuous cooling transformation diagram for a eutectoid iron–carbon alloy.
Continuous cooling transformation diagram for a eutectoid iron–carbon alloy and superimposed cooling curves, demonstrating the dependence of the final microstructure on the transformations that occur during cooling.