Download
1 / 22
220 likes | 305 Views
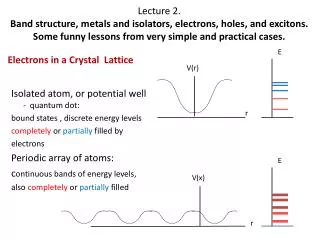
Energetic Electrons in a Flaring Loop. H. Nakajima, J. Sato, Y. Hanaoka, M. Shimojo, and A. Asai. ・ Microwave & HXR observations of the 2002 Aug 24 flare on or behind the W-limb . ・ Showed a clear loop like structure. Observations NoRH: the whole course of the duration.

E N D
Energetic Electrons in a Flaring Loop H. Nakajima, J. Sato, Y. Hanaoka, M. Shimojo, and A. Asai
・ Microwave & HXR observations of the 2002 Aug 24 flare on or behind the W-limb.・ Showed a clear loop like structure. • Observations NoRH: the whole course of the duration. RHESSI: only the rising phase.
Motivation • EHXR≦ 100 keV, E34GHz ≧ 1 MeV • Structural & spectral relationship bet. Microwave & HXR. • Some information on acceleration of ele. & pitch angle distribution of accelerated ele.. • Explanation of Masuda flares.
First peak A big and long-duration flare(GOES: X3.1, >3hrs) 34GHz: always optically thin. Conducted analyses around 00:56 UT.
N-FT: Behind the limb. S-FT: Just on the limb. TRACE Movie of ~106 plasma (195Å) 00:41 UT ~ 01:40 UT
34 GHz contour level: 0.1, 0.25, 0.5, 0.75 Microwave Loop 34GHz: Spat.res. ~ 8”x9” Dist. Betwn FPs: 60” Loop width: 14.4”±0.5” Loop top source: visible.
34GHz image Contour: 0.1, 0.25, 0.5, 0.75
Brightness distr. along the loop Tb Both loop top source & footpoint source exist. (corresponds to trap & prec. components.) South FT top North FP Distance (arcsec) along the loop axis
First Peak Decay time const.: ~ 30 s Peak delay: 4~10 Loop top North FP (x1.7) South FP Bs > Bn >Bt Time (s)
μwave spectrum γ= 2.4 δ= 4.0 Ramaty code: B = 300 Gauss, θ= 80°,source size = 25”
Bastian (1998) 17 GHz B=300 Gauss Effective energy of ele. at 34 GHz is > 1 MeV
HXR images: Color: 6 – 12 keV Contour: 30 - 50keV Loop height: decreases with decreasing height.
Overlay of 17GHz & HXR images HXT: Spat. Res. ~ 10 “ HXR image: 30 - 50 keV 10% step from 10% Loop top source: 14”x 24” HXR loop top source: higher than 17 GHz Source by 7” ± 5” N-FT: no FT emiss. S-FP: μ --FT emiss. HXR -- no FT emiss. Asymmetrical loop!
HXR spectral fitting E > 10 keV: Double pow.law E < 34 keV γ= 5.7 E > 34 keV γ = 7.0
Both the HXR image and thick-thin spectrum: consistent with trapping of ele. in the loop. Electrons ≦ ~34 should die in the corona. The transition energy of ele. Et ~ 34 keV (= HXR trans. energy) Et = { (N/1020)×(0.7 /cosα) }1/2 ×20 keV N (column depth) = (2×1010)×(3.9×109) = 7.8×1019 cm-2 α : average pitch angle distribution ∴ cosα = 0.19 α = 79°
Result 34GHz flare: • The flaring loop at 34 GHz had roughly uniform width (14.4 ± 0.5), probably suggesting a small mirror ratio (M=Bfoot/Btop). This is consistent with small peak delay of Tb of the top with respect to those at the footpoints. Loss cone angle α : sin2α= 1/M = {(14.4-0.5) /(14.4)}2 ∴ α ~ 75° M ~ 1.07 • Both a loop top component and footpoint components existed. Microwave spectrum: • Elect. spectr. index = δ = 4.0 ± 0.9, B ~ 300 Gauss
HXR flare at energy of 30-50 keV: • Clearly a loop top source existed. Almost entire emission came from the coronal part. • The HXR loop top source was located slightly above the microwave source with the same loop width. The microwave source was located at the same height as the lower energy source. HXR spectrum: • Thick-thin HXR emission suggests a large pitch angle distribution (average 80°) of electrons. consistent with Fretcher & Martens model for the Masuda Flare • Electron spectrum index is estimated to be 6.0 ~ 6.7, which is significantly softer than spectrum index (4.0) from microwaves. need an additional acceleration for MeV electrons.
Pitch angle distribution of MeV electrons responsible for microwaves • If we assume that electrons responsible for 34 GHz emission hasa uniform pitch angle distribution. Tb ∝ N B3.4 (sinθ)2.2 ∝ N (∵ B ~ const., θ~90°) Nttrap/ Ntpre is estimated to be roughly1/3 from obs.. • On the other hands, Nttrap/ Ntpre is calculated to be {∫7990 sinα dα / ∫079 sinα dα}= 0.35 • MeV electrons may haveroughly a uniform pitch angle distribution!
Brightness distr. along the 34 GHz loop Tb South FT North FP Distance (arcsec) along the loop axis
Melnikov, Et.al,2002 BFT /Btop =2