Download
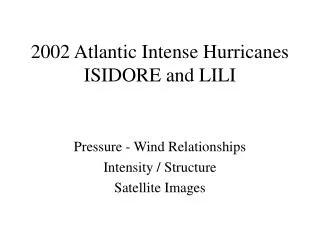
1 / 21
210 likes | 340 Views
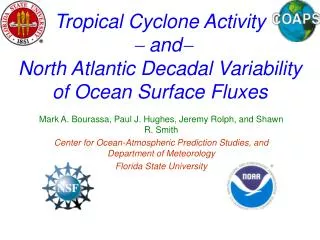
Hurricanes and Atlantic Surface Flux Variability. Mark A. Bourassa 1,2 , Paul J. Hughes 1,2 , Jeremy Rolph 1 , and Shawn R. Smith 1 1. Center for Ocean-Atmospheric Prediction Studies 2. Department of Meteorology The Florida State University. Stresses Storm Surge Forecast.

E N D
Hurricanes and Atlantic Surface Flux Variability Mark A. Bourassa1,2, Paul J. Hughes1,2, Jeremy Rolph1, and Shawn R. Smith1 1. Center for Ocean-Atmospheric Prediction Studies 2. Department of Meteorology The Florida State University
Stresses Storm Surge Forecast • Storm surge in Apalachee Bay was underforecast by 4 ft. • The local surge model was OK, but the extra 4ft came for distant forcing. • A coastally trapped wave propagated up the coast with the storm. The Florida State University
Objectives • SST minus 10m air temperature? • ‘Surface’ humidity minus 10m humidity? • Can these changes be linked to Atlantic Tropical Cyclone variability drought or other things that impact people and businesses? • Examine Atlantic Ocean surface turbulent energy fluxes for multi-decadal variability. • Latent heat flux • Sensible heat flux • What related variables are changing with the fluxes • Sea surface temperature (SST) • Near surface (10m) wind? • Near surface (10m) air temperature • Near surface (10m) humidity The Florida State University
What are surface turbulent fluxes? Latent Heat Flux (E) • Vertical transport of energy associated with the phase change of water • Forced by wind speed and air/sea temperature differences Sensible Heat Flux (H) • Vertical transport of energy associated with heating, but without a phase change • Forced by wind speed and vertical moisture differences Stress () • Vertical transport of horizontal momentum • Forced by vertical momentum differences Atmosphere E+ E- H+ H- - + Ocean The Florida State University
Relevance of Surface Turbulent Fluxes • Modulations in the above induce changes in the latent and sensible heat fluxes OR modulations in heat fluxes change the above variables. • Sensitive indicators of changes in the climate system, integrating changes in the following variables. • Wind Speed • Air/Sea temperature difference • Vertical moisture differences The Florida State University
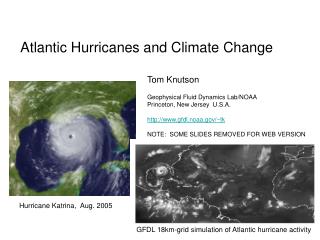
Forcing Product Inconstancies: Zonal Averaged Latent Heat Flux • NWP Products: • NCEPr2 • JRA • Satellite Product: • HOAPS • NWP/Satellite Hybrid • WHOI • In Situ • NOC (AKA SOC) • FSU3 Latitude 40 60 80 100 120 140 160 180 Wm-2 The Florida State University
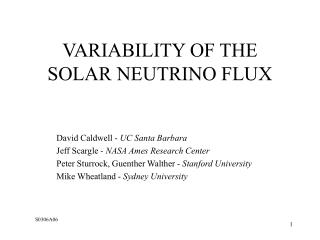
Forcing Product Inconstancies: Zonal Averaged Sensible Heat Flux • NWP Products: • NCEPr2 • JRA • Satellite Product: • HOAPS • NWP/Satellite Hybrid • WHOI • In Situ • NOC (AKA SOC) • FSU3 Latitude 0 10 20 30 40 Wm-2 The Florida State University
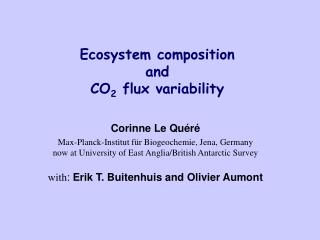
Latent Heat Flux: January 1989 Sensible Heat Flux: January 1989 15 45 75 105 135 175 Wm-2 10 30 50 70 90 110 Wm-2 Latent heat flux: Sensible heat flux: The Florida State University
Input Data for Our Flux Product(FSU3 Winds and Fluxes) • International Comprehensive Ocean-Atmosphere Data Set (ICOADS; Woodruff et al. 1987; Worley et al. 2005) • Reynolds SSTs (Reynolds 1988) • Bias corrections for ship based SSTs is difficult because it varies greatly on ship to ship basis The Florida State University
Average Number of Ship Observations January Average Number of Ship Observations 0 1 4 9 16 25 36 49 64 >81 August 0 1 4 9 16 25 36 49 64 >81 The Florida State University
Height Wind Speed Creating the FSU3 Fluxes • Beaufort speeds converted to 10 m values (Lindau 1995) • Buoys height adjusted to 10m winds (Bourassa et al. 1999) • Ship anemometers treated as 20m winds, and height adjusted. • These data are input into a variational technique (Bourassa et al. 2005) • We currently have research quality fields for 1978 through 2004 • Atlantic Basin & Indian Ocean • The bias corrected observations of winds, temperatures, and humidities are averaged monthly, and in 1x1 bins. • Bias adjustments • Air temperature for heat of the superstructure (Berry et al. 2004) • SST adjusted from bulk to skin temperature (Donlon and Robinson 1997) • Winds The Florida State University
Is Our Gridding Technique Effective?Validation of Wind Fields • Biases (not shown) are very small. • Random errors small over most of be basin. • Larger in areas of relatively poor sampling • Larger in areas with more natural variability • Monthly mean Winds from August 1999 through Dec. 2004 are compared to similarly averaged fields from SeaWinds on QSCAT. 0.3 0.6 0.9 1.2 1.5 1.8 2.1 2.4 2.7 ms-1 The Florida State University
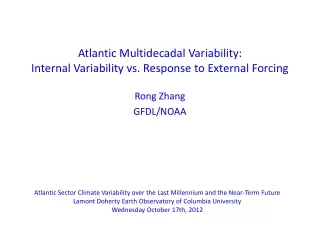
Atlantic Mulitdecadal Oscillation (AMO) • Thought to be forced by fluctuations in the thermohaline circulation (Schlesinger and Ramankutty 1994;Kerr 2000;Delworth and Mann 2000) • Period of 65-70 years • Linked to anomalous precipitation patterns and North Atlantic hurricane activity (Enfield et al. 2001;Sutton and Hodson 2005;Goldenberg et al. 2001) Enfield et al. 2001 The Florida State University
Tropical North Atlantic • Recall that we have a research quality time series for the period 1978 through 2004. • This is slightly longer than the satellite period for which has arguably been called good for NCEP reanalyses. • A longer time series would be better! The Florida State University
Stretching Our Time Series • The density of in situ (Volunteer Observing Ship) data from the Atlantic Ocean peaks in the 1980s. • A data set based on in situ data could be extended much further back in time. • We used ICOADS data from Jan. 1956 through Dec. 1977 to extend our data set. • All our automated procedures were used; however, we did not apply the visual quality control step. • Skipping this step is analogous to adding noise. • We reduce this noise by applying spatial averages in Hovmueller diagrams. The Florida State University
Latent Heat Flux: Northern Tropical Atlantic • There is a 11 to 13 year cycle superimposed on a longer term trend or cycle. • The trend largely due to the changing anemometer heights. • AMO related variability is suggested by the change in 1995. • Hints of ENSO-related variability. • Recall that peak hurricane count happened in 2003-05, and the early sixties had an atypically large fraction of strong hurricanes. • These years have positive AMO anomalies and are near the peak of the 11 to 13 year cycle. The Florida State University
Tropical North Atlantic Air/Sea Humidity Differences • Considerable matching variability on the 11 to 13 year scale. • AMO related variability is suggested. • 11 to 13 year variability is apparent, but harder to see on this color scale. The Florida State University
Summary • Changes in LHF due to changes in wind speed are convoluted with changing anemometer heights. • There is variability in heat fluxes associated with the AMO • Larger heat input into the atmosphere for the periods associated with increased hurricane activity. • An 11 to 13 year cycle is found in the latent heat fluxes and in the air/sea moisture differences. • This 11 to 13 year variability is not nearly as apparent in time series of qair or qsfc. • Future work will look into what is causing the 11 to 13 year cycle. • Changes in tropical Atlantic latent heat fluxes are closely linked to changes in air/sea moisture difference. The Florida State University
Hurricanes and Atlantic Surface Flux Variability Mark A. Bourassa1,2, Paul J. Hughes1,2, Jeremy Rolph1, and Shawn R. Smith1 1. Center for Ocean-Atmospheric Prediction Studies 2. Department of Meteorology The Florida State University
Air/Sea Temperature Difference: SST - Tair The Florida State University
SHF??? The Florida State University