Download
1 / 1
10 likes | 113 Views
Disclosure and Utility of Census Journey-to-Work Flow Data from the American Community Survey Is There a Right Balance? Ed Christopher (Federal Highway Administration) Nanda Srinivasan (Cambridge Systematics, Inc.).

E N D
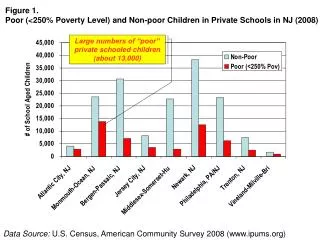
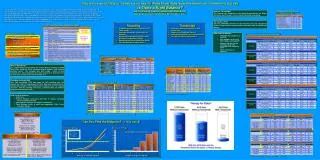
Disclosure and Utility of Census Journey-to-Work Flow Data from the American Community Survey Is There a Right Balance? Ed Christopher (Federal Highway Administration) Nanda Srinivasan (Cambridge Systematics, Inc.) Early in 2003 the transportation community contracted with the Census Bureau to produce the CTPP2000, a special tabulation. A special tabulation is made up of user defined tables and falls outside the “standard” products distributed by the Census Bureau like SF1, SF3, and PUMS. With the 2000 decennial data, the Census Bureau required all special tabulations to have disclosure avoidance techniques applied to them. For CTPP2000 this meant the institution of rounding and threshold techniques in addition to the already applied procedures of data swapping and imputation. The specific disclosure rules for the ACS after 5 years of data collection are likely to be similar, if not stricter than to those used for CTPP2000. In this poster the effects of rounding and thresholds on the CTPP are exposed along with an examination of their effects under the ACS. Comparison of Key Data Issuesin the Analysis Data Sets What are Thresholds? The threshold rule stated that no data would be provided for any Origin-Destination pair that had 3 or less records (trips) before weighting. The Analysis Plan Take data CTPP2000 and ACS test data for three areas and compare the number of trips/workers and the number of OD pairs with Thresholds and without. • Rounding • Produces Inconsistencies Among CTPP Table Values • Caused a Systematic Undercount of Workers • Did not Show a Significant Noticeable Difference on Summary Levels • Rounding to 5 Would Have Been Better • Was Not Well Received by Users • Thresholds • Eliminates Most of the OD Pairs and Commuters • Renders the Flow Data Useless • Undermines the Utility of Small Area Data • Was Not Well Received by Users Part 3 – Worker Flow Tables with Disclosure Rules No recordthreshold • Data Used for Analysis • CTPP2000 Part 3 Tables 3-01 and 3-06 • ACS NCHRP 8-48 Test Data Part 3 Tables 3-01 and 3-03 • Workers who lived in and worked in study area including those working at home • Three study areas or Counties CTPP2000 Disclosure Avoidance Rules Workers Lost Due To Rounding and Thresholds Must have 3 unweighted records Part 1 – At Residence (121 Tables) All Tables Rounded Zero = 0 1 through 7 = 4 8 through ∞ = Nearest Multiple of 5 Part 2 – At Workplace (68 Tables) All Tables Rounded Part 3 – Worker Flows (14 Tables) All Tables Rounded Some Tables with Thresholds 1990 Commuters Lost Due to Rounding What is Rounding? For confidentiality considerations the Census Bureau rounded all CTPP 2000 tables except for those containing means, medians, and standard deviation values. The rounding rules were simple. Values of zero remained zero. Values between 1 and 7 were rounded to 4. And values of 8 or more were rounded to the nearest multiple of 5. ACS Urban Test Counties in the NCHRP 8-48 Database Source: 1990 Part 3 CTPP. Rounding Analysis Plan Take 1990 un-rounded CTPP data, apply the 2000 rounding rules and examine the affects of rounding on the data. How does rounded and un-rounded data compare? Was rounding values between 1 and 7 to 4 a good decision? Did the rounding rules have a different affect on different geographical Summary Levels? Number and Percent of Trips per OD Pair Source: NCHRP 8-48 Test Dataset Tables • Data Used for Analysis • 1990 Part 3 • Resident Workers (commuters who lived in region), excluding those who worked at home • Three Regions (Chicago, Los Angeles, and Boston) • Three Summary Levels or small area geographies (TAZs, Tracts and Block Groups) Source: CTPP2000 Part 3 and ACS NCHRP 8-48 Test Data Part 3. Study Areas Used for Rounding Analysis Source: 1990 CTPP data for Commuters who live in the region, excludes workers at home. Can You Find the Midpoint? — It is not 4! Percent of All Trips Percent of All Trips 40 16 Taz Tract BG Boston Block Group Summary 14 30 12 10 20 8 6 10 4 2 0 1 2 3 4 5 6 7 1 2 3 4 5 6 7 Number of Trips per OD Pair Number of Trips per OD Pair Source: CTPP2000 Part 3 and ACS NCHRP 8-48 Test Data Part 3.