Download
1 / 14
140 likes | 289 Views
Thermal Wind: Stratified Geostrophic Dynamics. v/z = -g/( r 0 f) r/ x. Margules Fronts resulting from Geostrophic Adjustments. Mid-shelf fronts. Outer shelf fronts. Eddies. Tidal mixing fronts. Thermal Wind: Atmospheric Jet Stream. Horizontal view. B.

E N D
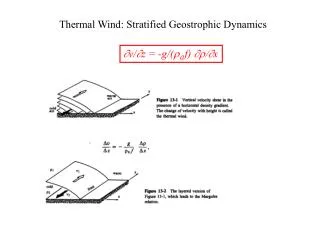
Thermal Wind: Stratified Geostrophic Dynamics v/z = -g/(r0 f) r/x
Margules Fronts resulting from Geostrophic Adjustments Mid-shelf fronts Outer shelf fronts Eddies Tidal mixing fronts
Thermal Wind: Atmospheric Jet Stream Horizontal view B 1 Jetstream passing north of the UK bringing settled, dry and warm weather 2 Jetstream passing further south, causing weather that is unsettled and cool for the time of year A z light (warm) Vertical view v/z = -g/(r0 f) r/x dense (cold) x B A
Thermal Wind: Jet Stream on Nov.-3, 2004 v/z = -g/(r0 f) r/x 850-mb (near surface) 300-mb (aloft) Temperature (color) Height of pressure surface (lines) Winds (arrows) http://opwx.db.erau.edu/~mullerb/Therm_wind.html
Gulf Stream Franklin & Folgers (1768) Brown et al. (1988)
Gulf Stream Section Density Temperature http://kingfish.coastal.edu/marine/gulfstream/p2a.htm
Gulf stream Velocity sections
Aug.-22, 2005 Ug(y,z) Titan's Atmospheric Temperature q and Thermal Winds Ug (z) (y,z) N S N S Flasar et al. (2005)
-0.77 Sv -0.92 Sv 0.90.10 Sv -0.91 Sv -1.03 Sv Greenland +4.3 Sv -4.8 Sv July/August 2003 ADCP Survey Volume Flux Summary 1 Sv=106 m3/s ~5 Amazon ~1000 Delaware
Density Salinity Temperature
Thermal Wind cm/s Observed: cm/s
S
Estimating Absolute Geostrophic Transport: Vg = relative geostrophic VADCP = observed velocity V0(x)=Vg-VADCP Across-channel integral of f/g times V0(x) Canada Greenland