Download
1 / 28
280 likes | 417 Views
OptIPuter and ENDfusion- Eliminating Bandwidth as an Obstacle in Data Intensive Sciences . 21 st NORDUnet Networking Conference Reykjavik, Iceland August 26, 2003. Dr. Larry Smarr Director, California Institute for Telecommunications and Information Technologies Harry E. Gruber Professor,

E N D
OptIPuter and ENDfusion-Eliminating Bandwidth as an Obstacle in Data Intensive Sciences 21st NORDUnet Networking Conference Reykjavik, Iceland August 26, 2003 Dr. Larry Smarr Director, California Institute for Telecommunications and Information Technologies Harry E. Gruber Professor, Dept. of Computer Science and Engineering Jacobs School of Engineering, UCSD
Abstract The OptIPuter is a radical distributed visualization, teleimmersion, data mining, and computing architecture. The National Science Foundation recently awarded a six-campus research consortium a five-year large Information Technology Research grant to construct working prototypes of the OptIPuter on campus, regional, national, and international scales. The OptIPuter project is driven by applications leadership from two scientific communities, the US National NSF's EarthScope and the National Institutes of Health's Biomedical Imaging Research Network (BIRN), both of which are beginning to produce a flood of large 3D data objects (e.g., 3D brain images or a SAR terrain datasets) which are stored in distributed federated data repositories. The project is led by the California Institute for Telecommunications and Information Technology and by the Electronic Visualization Laboratory at the University of Illinois at Chicago. Essentially, the OptIPuter is a "virtual metacomputer" in which the individual "processors" are widely distributed Linux PC clusters; the "backplane" is provided by Internet Protocol (IP) delivered over multiple dedicated 1-10 Gbps optical wavelengths; and, the "mass storage systems" are large distributed scientific data repositories, fed by scientific instruments as OptIPuter peripheral devices, operated in near real-time. Collaboration, visualization, and teleimmersion tools are provided on tiled mono or stereo super-high definition screens directly connected to the OptIPuter to enable distributed analysis and decision making. A new proposal called "ENDfusion: End-to-End Data Fusion in a National-Scale Urban Emergency Collaboratory" adapts and extends some of the OptIPuter concepts to support collaboratories for high resolution geographic information systems and earthquake response.
Where is Telecommunications Research Performed?A Historic Shift Percent Of The Papers Published IEEE Transactions On Communications 70% U.S. Industry Non-U.S. Universities 85% U.S. Universities Source: Bob Lucky, Telcordia/SAIC
Cal-(IT)2– Research on the Future of the Internet The California Institute for Telecommunications and Information Technology 220 UC San Diego & UC Irvine Faculty Working in Multidisciplinary Teams With Students, Industry, and the Community www.calit2.net
Application Barrier One:Shared Internet Limits Speed of File Transfers • NASA Earth Observation System • Over 100,000 Users • Two Million Data Products Delivered per Year • Measured Throughput for Data Transfers • 10-40 Mbps (May 2003) Mainly Over Abilene • Interactive Megabyte Possible
Application Barrier Two:Gigabyte Science Data Objects • Hundred Million Pixel 2-D Images • Microscopy or Telescopes • Remote Sensing • GigaZone 3-D Objects • Supercomputer Simulations • Seismic or Medical Imaging • Interactive Analysis and Visualization of Such Data Objects is Impossible Over Shared Internet
Very Large Biological Montage Images • 2-Photon Laser Confocal Microscope • High Speed - Ultrawide Field • On-line Capability • Image Sizes Exceed 16x Highest Resolution Monitors • ~150 Million Pixels! IBM 9M Pixels Source: David Lee, NCMIR, UCSD
TeraFLOP Computing Enables High Resolution of 3D Flow Details 1024x1024x1024- A Billion Zone Computation of Compressible Turbulence This Simulation Run on Los Alamos ASCI SGI Origin Array U. Minn.SGI Visual Supercomputer Renders Images Vorticity LCSE, Univ of Minnesota
Removing User Networking Barriers:Global Intellectual Convergence • SERENATE is a Strategic Study into the Evolution of European Research and Education Networking Over the Next 5-10 Years • Some Findings • On A Multi-year Timescale, Move Towards Optical Switching • Evolution Towards Heterogeneous NREN Networks (and GÉANT), with General Internet Use (Many-to-many) via Classical Packet Switching and: • Specialised High-Speed Traffic (Few-to-Few) via Optical Paths? OptIPuter Project • Even End-to-End Paths?? ENDfusion Project Source: David Williams, CERN
From SuperComputers to SuperNetworks--Changing the Grid Design Point • The TeraGrid is Optimized for Computing • 1024 IA-64 Nodes Linux Cluster • Assume 1 GigE per Node = 1 Terabit/s I/O • Grid Optical Connection 4x10Gig Lambdas = 40 Gigabit/s • Optical Connections are Only 4% Bisection Bandwidth • The OptIPuter is Optimized for Bandwidth • 32 IA-64 Node Linux Cluster • Assume 1 GigE per Processor = 32 gigabit/s I/O • Grid Optical Connection 4x10GigE = 40 Gigabit/s • Optical Connections are Over 100% Bisection Bandwidth
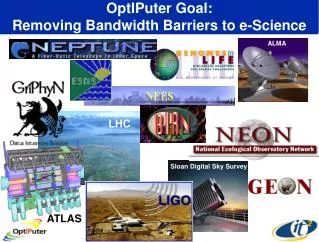
OptIPuter LambdaGrid Global Laboratory Brain Tissue Lake Tahoe • NSF Large Information Technology Research Grant • $13.5 Million Over Five Years • UCSD and UIC Lead Campuses—Larry Smarr PI • Co-PIs: Tom DeFanti, Jason Leigh, Phil Papadopoulos, Mark Ellisman • Project Manager, Maxine Brown • Partnering Campuses • USC, UCI, SDSU, NU, Texas A&M, Univ. Amsterdam • Industrial Partners: • IBM, Sun, Telcordia/SAIC, Chiaro Networks, Calient, Glimmerglass • Driven by Large NSF and NIH Applications NIH Biomedical Informatics Research Network NSF EarthScope www.optiputer.net
Science Drivers for a Radical New Net-Centric Architecture—The OptIPuter • Data Intensive Neuro & Earth Sciences • Each Data Object is 3D and Gigabytes • Data in Distributed Federated Repository • Want to Interactively Analyze and Visualize • Need End-to-End Deterministic Networks • OptIPuter Science Requirements • Computing PC Clusters • Communications Dedicated Lambdas • Data Large Lambda Attached Storage • Visualization Viz Clusters • Global Collaboration Multi-Scale Latencies Goal: Punch a Hole Through the Internet Between Researcher’s Lab and Remote Data!
What is the Best Application Usageof Routed vs. Switched Lambdas? • OptIPuter Evaluating Both • Routers • Chiaro • Juniper • Cisco • Force10 • Optical Switches • Calient • Glimmerglass • UCSD Focusing on Routing Initially • UIC Focusing on Switching initially • Next Year Merge into Mixed Optical Fabric
OptIPuter Campus-Scale Experimental Network The UCSD OptIPuter Deployment To CENIC SDSC SDSC SDSCAnnex Juniper T320 Preuss Engineering High School JSOE CRCA SOM Medicine 6thCollege Phys. Sci -Keck Collocation Node M Chiaro Estara Earth Sciences ½ Mile SIO Funded by NSF OptIPuter Grant and UCSD Source: Phil Papadopoulos, SDSC; Greg Hidley, Cal-(IT)2
OptIPuterMetro-Scale Experimental Network • Linked UCSD and SDSU • Dedication March 4, 2002 UCSD Linking Control Rooms 44 Miles of Cox Fiber SDSU Cox, Panoram, SAIC, SGI, IBM, TeraBurst Networks SD Telecom Council
Proposed OptIPuterState-Scale Experimental Network Source: CENIC NASA Ames? USC UCI SDSU UCSD
Proposed OptIPuter Dedicated Optical Fiber National-Scale Experimental Network Chicago OptIPuter Starlight NU, UIC USC, UCI UCSD, SDSU SoCal OptIPuter “National Lambda Rail” Source: John Silvester, Dave Reese, Tom West-CENIC
OptIPuter Uses TransLight Lambdas to Connect Current and Potential International-Scale Partners Univ. of Amsterdam NetherLight Current OptIPuter Starlight NU, UIC The OptIPuter Was Born Global! Source: Tom DeFanti, UIC
OptIPuter Open Source LambdaGrid Software for Distributed Virtual Computers Source: Andrew Chien, UCSD OptIPuter Software Architect
OptIPuter Protocol Experimentson TeraGrid Lambdas • SDSC To NCSA—2x10Gbps Lambdas • 30 Itanium Cluster Nodes at Each End • Streamed 2 Gigabytes of Data • 100 Times, Each At A Rate Of 1 Gb • Quanta’s Reliable Blast UDP Protocol (RBUDP) • Quanta Is An Extensive Toolkit For Data Sharing www.evl.uic.edu/cavern/quanta • Throughput of 18.6Gbps / 20Gbs • Original User Transfer Rate • TCP/IP 10 Mbps Over 10 Gb Lambda • Paul Woodward, Fluid Dynamics Simulation Data • 1000x Improvement Source: Jason Leigh, UIC EVL www.evl.uic.edu/cavern/rg/20030817_he
LambdaGrid Control Plane Paradigm Shift OptIPuter: Distributed Device, Dynamic Services, Visible & Accessible Resources, Integrated As Required By Apps Traditional Provider Services: Invisible, Static Resources, Centralized Management Invisible Nodes, Elements, Hierarchical, Centrally Controlled, Fairly Static Unlimited Functionality, Flexibility Limited Functionality, Flexibility Source: Joe Mambretti, Oliver Yu, George Clapp
Extending to IPv6Amsterdam to Japan Using Native IPv6 Network IGRID 2002 (Amsterdam, Sept 2002) UHVEM (Osaka, Japan) Tokyo XP 6tap/StarLight ATM SW ATM SW R TransPACAPAN OC3 SURFnet SURFnet R Osaka University WIDE network IPv6 via JGN VBNS Gb Ether ESnet SDSC Abilene JuniperM40 Gb Ether Native IPv6oc12 peer oc3 oc192 SDSC V6 services NCMIR (San Diego) JuniperT640 Supercomputing 2002 Baltimore, Nov 2002 Last Week Partially On Lambdas! Source: UCSD’s Tom Hutton, SDSC & David Lee, NCMIR
ENDfusion: End-to-End Networks for Data Fusion in a National-Scale Urban Emergency Collaboratory Cal Office of Emergency Services NCSA Facility US Geological Survey StarLight @ NU ACCESS DC UCI UCSD Jacobs & SIO SDSU UIC UC/ANL San Diego Downtown Width Of The Rainbows = Amount of Bandwidth Managed As Lambdas Blue Lines Are Conventional Networks Source: Maxine Brown, EVL, UIC
Real-Time Earthquake AlertsVery Important in Iceland! http://hraun.vedur.is
Planning for Optically Linking Crisis Management Control Rooms in California California Office of Emergency Services, Sacramento, CA
Crisis Management Will RequireUltra-High Resolution Remote Imaging • US Geological Survey EROS Center Data: • 133 Urban Areas: • One Foot Resolution • 100,000 x 100,000 Pixels for 20 sq.mile Urban Area • 10 Billion Pixels/Image! • JuxtaView (UIC EVL) for PerspecTile LCD Wall • Digital Montage Viewer • 6000x3000 Pixel Resolution • Display Is Powered By • 16 PCs with Graphics Cards • 2 Gigabit Networking per PC Source: Jason Leigh, EVL, UIC; USGS EROS
ENDfusion Virtual 3D High Resolution CampusWith High Resolution Stereo Imagery Each Square Meter Will Have a Unique IPv6 Internet Address SDSU Campus Center 4 cm Resolution Infrared Four IPv6 Addresses Source: Laurie Cooper, SDSU Eric Frost, Dawn Wise, SDSU-OptIPuter
A High Definition Access Grid as Imagined In 2007 In A HiPerCollab SuperHD StreamingVideo 100-Megapixel Tiled Display Augmented Reality ENDfusion Project Source: Jason Leigh, EVL, UIC