Download
1 / 14
140 likes | 292 Views
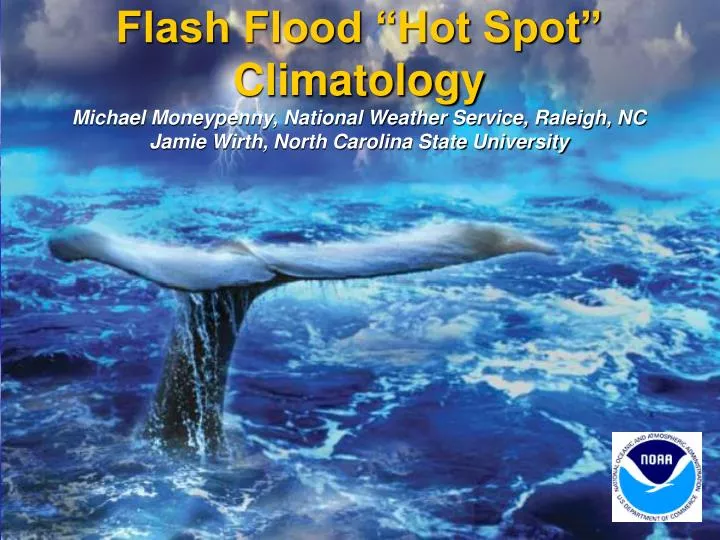
Flash Flood “Hot Spot” Climatology Michael Moneypenny, National Weather Service, Raleigh, NC Jamie Wirth, North Carolina State University. Project History. Part of a larger collaborative COMET program between NCSU and NWS to study inland flooding from tropical systems

E N D
Flash Flood “Hot Spot” ClimatologyMichael Moneypenny, National Weather Service, Raleigh, NCJamie Wirth, North Carolina State University
Project History • Part of a larger collaborative COMET program between NCSU and NWS to study inland flooding from tropical systems • “Hot Spots” are not limited to tropical flooding, so their identification has year-round application
Motivation • Average of 80 deaths annually in the U.S. • Deaths are primarily due to folks driving into flooded areas • Most problem areas are well-known to local emergency officials For Example…
Methodology • Contact Emergency Managers in each county as well as local (city/town) officials • Fact-to-face meetings to locate and discuss peculiarities of each “hot spot” • Visit the ‘hottest’ “hot spots” personally to gather detailed information & pictures
Hmmmmm…No Guardrail!!! Creek partially dammed Hardy Creek Bridge on Old Cottonville Rd
Problems We Encountered • Difficulty finding time to visit the (31) counties – we tried to send 2 individuals on each trip to stimulate the staff’s enthusiasm • Counties were at different levels of GIS technology – 1) topo maps we hand-annotated during the visit, 2) large poster-sized maps (also often hand-annotated), 3) shapefiles
Problems - continued • Definition of “hot” – “Someone said this bridge flooded back in ’73…etc”
The Work in ProgressDisplaying The Information • AWIPS Graphics - basically just a point and a name Text - a reference file on text workstations contains great detail ‘cut-and-paste’ into statements • Intranet
Dispatchers are not always aware of the problem areas – Stanly County rescued 4 individuals after our SOO requested that a unit be sent to one of the ‘hot spot’ locations we had mapped into AWIPs Proof of Concept