Download
1 / 58
590 likes | 734 Views
Explore key investment themes in the property and casualty insurance industry, including market cap trends, alternative capacity gains, and the impact of private equity on M&A. Stay informed on the evolving insurance value chain and emerging investment opportunities.

E N D
The insurance value chain: key investment themes • John Kraska • September 2, 2015
U.S. & BERMUDA P&C u/w market cap “only” $354B Peak Market Cap Of $755B In May 2007 Currently $869B Berkshire AIG AIG Market Cap ~45% Of P/C Industry Market Cap In Late 2000. Berkshire Hathaway ~42% Now
Small market cap lack of investor interest FOR U.S. P&C INDUSTRY Property Casualty Underwriters (Ex. AIG, BRK) Only $354B U.S. & Bermuda P/C Industry U.S. & Bermuda P/C Industry
25 years of declining peak valuations Source: FactSet, Dowling & Partners Analysis
TOP WORLDWIDE GROUPS BY MARKET CAP … Asia showing increased M&A appetite abroad v2.0 * Berkshire Hathaway Bubble Not Shown ($350B), Includes Fairfax (Canada); ** Includes QBE (Australia); Source: FactSet
cyclical changes suppressing returns: lower interest rates & leverage “New Money Rate” “Imbedded Yield” Source: A.M. Best Aggregates & Averages, D&P Estimates, U.S. Department of Treasury, Company Reports
Economics of 12% ay roe New Money Pre-tax Investment Yield 2001 2015 20-25 pts of Improvement Needed 1985 Assumptions: Duration: 1.8 years Expense Ratio: 28% Surplus p/t Yield: 250bps over new money Source: D&P Analysis
Different return expectations over time 15% ROE ERA SINGLE DIGIT? 12% ROE ERA CR NEEDED FOR 12% ROE ESTIMATED ULTIMATE AY CR CR NEEDED FOR 10 YR TRS + 700BPS CR NEEDED FOR 15% ROE Source: A.M. Best Aggregates & Averages; D&P Estimates
Secular Changes ARE Permanently Altering The (Re)Insurance Industry
Cat bonds took 15+ years to DISRUPT PRICING (2012) June 1996 First Cat Bond Issued In Dec-96 By St. Paul Re
The Pension fund “martini” Pension Fund Capital Under Management $30 trillion Global property cat limit $341 billion Global insurance sector capital (including life) $2.5 - $3 trillion Global retro capital <$30 billion Source: Guy Carpenter
“ALTERNATIVE CAPACITY” GAINS MARKET SHARE Guy Carpenter estimates non-traditional capacity at ~18% of total world wide cat limits. Ultimately, GC predicts alternative capacity could reach $115-150 by 2018. Doubles In 5 Years
Pension funds drive growthNEPHILA ALONE HAS ADDED ~$7B SINCE 2009 “Nephila Gorilla” $9.5B AUM Invested in Jun-08 Founded in ‘98 as part of Willis; Sells in ‘03
PROPERTY CAT PREMIUMS = ~ 10% OF GLOBAL NON-LIFE REINSURANCE $144.9B $12.3B $84.4B $3.5B ~$25B+ ~$4B+ $47.1B $2.0B Florida Remains The Global Cat Market “Peak Zone” $21.5B $0.8B $28.3B $1.9B 2015 Global Cat Market: $341B Limit; $21B Premium Source: Guy Carpenter estimates (as of 3/1/15)
JUNE 1ST 2012: Price taker becomes price maker = 3 renewals in Florida Assumes Rates Off 5-10% At Jun-15 Note: “Expected” c. ratio assumes a loss and G&A expenses are held constant. 2011 base c. ratio considers a 45% loss ratio, 10% commission ratio and 5% G&A. ratio. Source: D&P Analysis
Secular Changes ARE Permanently Altering The (Re)Insurance Industry
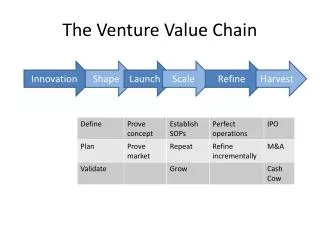
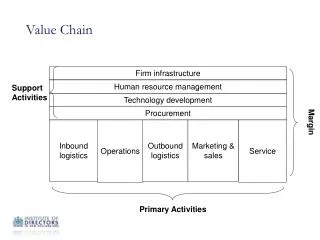
THE P/C (RE)INSURANCE VALUE CHAIN IS IN PLAY The (Re)Insurance Value Chain Moving Further From The “Customer” = More Pressure On Returns
CONSOLIDATION CHANGES THE BUSINESS → PE Independent → PE → PE Recent Transactions → PE → PE
Change in ownership of Top 100 brokers 1984 2000 2013 5 % 7 % 12 % 3 % 7 % 13 % By Revenue: 2 % 18 % 24 % Public 14 % 62 % 66 % Management 67 % Insurance Co / Other Bank 3 4 Private Equity 12 5 8 7 8 9 11 13 By Count: 4 63 76 77 More Institutionalized Ownership More Competitive Landscape PE-backed Brokers Continue To Be Exceedingly Active On The M&A Front Source: Dowling Hales
Private equity’s influence on M&A 2014 Broker Deals by Count Broker Deals by Buyer Industry • “Wave” 2 Buyers Will Be Aggressive Consolidators For Next 5-7 Years Source: Dowling Hales, D&P Analysis
M&A Pipeline remains strong Distribution by Number of Firms Distribution by Revenue(1) ~4,088 Firms Target Market for Consolidators ~$20B of Revenue / Target Market for Consolidators Brokers In Play = ~4.1K Firms And $20B of Revenue Note: (1) Estimated using midpoint of each revenue category except for Extra Large and Jumbo Source: Independent Insurance Agents and Brokers of America, Business Insurance and Dowling Hales estimates.
Deal Multiples, competition and valuations Source: Dowling Hales, Intercontinental Exchange (“ICE”) • Heightened competition is driving “average” multiples for deals into upper single digits (approaching/exceeding 10x for larger deals) but does not tell the entire story • Guaranteed purchase multiples have also moved higher (rather than a meaningful portion of the purchase price being held as an “earn out”) and the “price of entry” has increased (as shown by the minimum EBITDA multiples moving higher in recent periods) • Valuation is also very much in the eye of the beholder as buyers are increasingly prospective looking and at times will even give credit to synergies / revenues that are much further down in the business plan (i.e. “transactional EBITDA”) • This, lower interest rates / flexible lending and increased competition is the reason why multiples have moved up ~1-2x vs. long term averages
Intermediary Consolidation implications • Power Pendulum Continues Shift To Intermediaries • P/E Owners Continue To Drive Consolidation (Buying Revenue) • Number of Primary Insurance Markets Utilized Will Decline • Increased Compensation to Intermediaries In Form Of: • Supplemental / Contingent Commissions to Middle Market • Broker Managed / Controlled Facilities With Larger Brokers • Pricing Pressure For Both Primary Carriers & Reinsurers • Intellectual Capital & Modeling Tools Advantage Buyer Over Seller He Who Controls The Customer Wins
Secular Changes ARE Permanently Altering The (Re)Insurance Industry
“hedge fund re” = It’s All About Taxes “And probably from the structural point of view, the most disturbing one is hedge funds that offer tax benefits to the high income individuals that invest with them and, at the same time, go big time into asset risk, can afford, for that reason, higher combine ratios. And this, of course, is a deja vu for many of us, because we used to call that cash flow underwriting. And it may end in tears sooner or later because others may follow suit, even though the hedge fund part of the business so far is of course relatively small.” – Munich Re (August 7th 2014)
3 legs for a successful total return underwriter Underwriter • Offensive • “Capital Lighter” Model = ↑ ROE • New Business At Lower Return • Defensive • Retain Business Under • “Watfordization” Pressure Fees & Tax Savings Asset Manager Capital • Permanent Assets • Additional Fees / Product • Raising Initial $750M+ • Higher A/Tax Return
simplified view of a.m. best’s bcar financial model For Startup Reinsurer… The “De Facto” Regulator = + New Business Penalty
hedge fund reinsurance models “Content” Is King Model $1.2B Capital ($,B) $0.5B (David Einhorn) (John Paulson) $1.5B $1.1B (Dan Loeb) (Highbridge Capital) $1.2B (Two Sigma) $1.0B (BlackRock) $0.8B* Potential New Sponsors ? (Golub Capital) Pine River Re $0.8B* (Pine River Capital) * Press reports suggested target capital of $750M for Golub Capital and Pine River Re
Watford vs. arch re: PRICING IMPACT X X 78%? = 8pt Δ
It’s not New…Total return (re)insurers Source: Company Reports, Dowling & Partners Analysis
Secular Changes ARE Permanently Altering The (Re)Insurance Industry
AJIT JAIN: Keeps A Lid On prospective Pricing Source: A.M. Best Aggregates & Averages; 2014 Projected
Burlington northern ranks among the LARGEST of global REINSURERs BNSF ? Source: Company Reports, D&P Analysis
AJIT REACTS TO SECULAR INDUSTRY TRENDS Ajit Reacts
Secular Changes ARE Permanently Altering The (Re)Insurance Industry
Technology changes the COMPETITION START-UP (RE)INSURERS DISRUPTIVE DISTRIBUTION & NEW CAPITAL SOURCES TARIFF RATINGS MULTI-LINE ERA “SPECIALIST” MGAs, Pension Funds, Hedge Funds “Two Men, A Dog, A $1B & An A- Rating” Cloud Computing, Big Data, Direct Distribution, Sophisticated Algorithms Mainframe 1950 - 1965 Minicomputer 1965 - 1985 Micro P/C Era 1985 - 2010 Pre-1950s
google … FRIEND OR FOE to insurers? • Google Compare for Auto Insurance • Google Compare Up And Running In UK For 2+ Years • March 2015: Announces Launch Of Auto Insurance Comparison Site in CA Google Compare is NOT Becoming an Auto Insurer* * Google Presentation May 2015
PERSONAL AUTO: LARGEST INDIVIDUAL U.S. LINE Per D&P Report “Path To Driverless Cars” (9/7/2013)
Progressive then and now 1998 2015 Progressive Puts “Homeowners” / ASI On The Balance Sheet Founding CEO Peter Lewis Was The 1st To Point Out The Risk That Auto Insurance Might Ultimately Disappear. “The biggest risk we face is the end of auto insurance…at some time in the future there will be so many fewer, less severe auto accidents that it will disappear.” Founding CEO Peter Lewis (1998) Future Progressive Year 20XX: Homeowners Premium > Auto Premium?
We envision a world where … • Intermediaries Go Direct To Capital (Both Traditional & Non-Traditional). “Facilities” Grow To 25-30% Of Many Lines Of Business • AmWINS Deal With Nephila = A Game Changer • The Hartford’s Stealth Move With AARP • Ajit Jain Going Direct In Workers’ Comp • Excess Traditional Reinsurance & Primary Capital • Hedge Fund & Pension Capital • Reinsurers Should Not Be Public Companies In New World
For U.S. COMMERCIAL underwriters… WHERE DOES A DOLLAR go? Commissions & Brokerage 10¢ Taxes = 3¢ Loss Adj. Expense 14¢ Pure Losses = 57¢ Other G&A 5¢ Salaries 9¢ Profit 1¢ i.e. Expense Ratio i.e. Loss Ratio * Composite of 127 Commercial Lines Predominating Groups Over Last 10 Years (2004-2013), Source: SNL Data, D&P Analysis
We envision a world where … • Intermediaries Go Direct To Capital (Both Traditional & Non-Traditional). “Facilities” Grow To 25-30% Of Many Lines Of Business • AmWINS Deal With Nephila = A Game Changer • The Hartford’s Stealth Move With AARP • Ajit Jain Going Direct In Workers’ Comp • Excess Traditional Reinsurance & Primary Capital • Hedge Fund & Pension Capital • Reinsurers Should Not Be Public Companies In New World
We envision a world where … • Intermediaries Go Direct To Capital (Both Traditional & Non-Traditional). “Facilities” Grow To 25-30% Of Many Lines Of Business • AmWINS Deal With Nephila = A Game Changer • The Hartford’s Stealth Move With AARP • Ajit Jain Going Direct In Workers’ Comp • Excess Traditional Reinsurance & Primary Capital • Hedge Fund & Pension Capital • Reinsurers Should Not Be Public Companies In New World
AmWINS: A GREAT EXAMPLE OF WHERE THE WORLD IS HEADED … The largest U.S. wholesale broker with premium placements of $10B+ from 20K+ agents Partnered With Allianz Risk Transfer / Nephila… Exclusive “ETF” type arrangement between AmWINS and Allianz/Nephila for 10% of all “shared and layered” property business = should ~ $175M of premium. Partnered With A Long-term Capital Provider… Completes strategic investment by Public Sector Pension (PSP) Investment Board = 20 year money. Providing “Small Business” Flow… Two Sigma “rocket scientists” underwrite small business.
We envision a world where … • Intermediaries Go Direct To Capital (Both Traditional & Non-Traditional). “Facilities” Grow To 25-30% Of Many Lines Of Business • AmWINS Deal With Nephila = A Game Changer • Excess Traditional Reinsurance & Primary Capital • Hedge Fund & Pension Capital • Reinsurers Should Not Be Public Companies In New World
SIZE Matters In (Re)insurance … 2010 = Companies “Taken Out” / Merger of Equals (2011) (2010) (2015) (2015) Year of Transaction > $3B (2012) (2010) (2012)
SIZE Matters In (Re)insurance … 2015 “New” Combinations < $3B New Entrants