Download
1 / 16
170 likes | 217 Views
Learn why RooFit assigns asymmetric errors to data points in the context of ATLAS H → 4 lepton peak, presented with 5 analysis options including Bayesian and Frequentist approaches. Explore the implications on true values and confidence intervals.

E N D
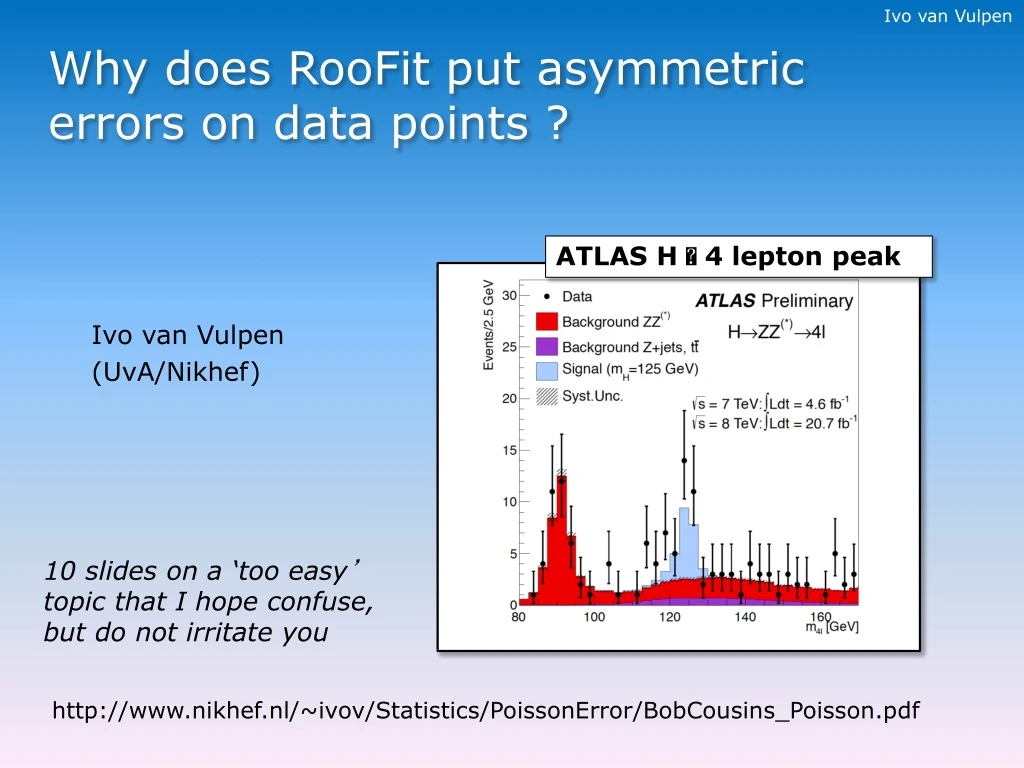
Why does RooFit put asymmetric errors on data points ? ATLAS H 4 lepton peak Ivo van Vulpen (UvA/Nikhef) 10 slides on a ‘too easy’ topic that I hope confuse, but do not irritate you http://www.nikhef.nl/~ivov/Statistics/PoissonError/BobCousins_Poisson.pdf
Why put an error on a data-point anyway ? ATLAS H 4 lepton peak 8 7 6 5 4 3 2 1 0 I’ll present 5 options. You tell me which one you prefer - Summarize measurement- Make statement on underlying true value
Known λ (Poisson) Binomial with n∞, p 0 en np=λ Probability to observe n eventswhen λare expected Poisson distribution Number of observed events ! P(Nobs|λ=4.0) λ=4.00 ! #observed λ hypothesis fixed varying
Known λ (Poisson) Binomial with n∞, p 0 en np=λ Probability to observe n eventswhen λare expected Poisson distribution Number of observed events P(Nobs|λ=4.9) λ=4.90 #observed λ hypothesis fixed varying
Option 1: Poissonspread for fixed λ the famous √N properties (1) Mean: (2) Variance: (3) Most likely: first integer ≤λ +2.00 -2.00 λ=1.00 λ=4.90
Treating it like a normal measurement What you have: 1) construct Likelihood λ as free parameter 2) Find value of λ that maximizes Likelihood 3) Determine error interval: Δ(-2Log(lik)) = +1
Likelihood (ratio) Probability to observe n eventswhen λare expected Likelihood Likelihood ! P(Nobs=4|λ) ! λ (hypothesis) #observed λ hypothesis fixed varying Note: normally you use -2log(Lik)
Option 2: likelihood (ratio) Likelihood: P(4|λ) +2.35 P(Nobs=4|λ) -1.68 λ (hypothesis) -2Log(Lik) Log(Likelihood) -1.68 +2.35 -2Log(P(Nobs=4|λ)) ΔL=+1 2.32 4.00 6.35
Bayesian: statement on true value of λ What you want: What you have: Likelihood: Poisson distribution “what can I say about the measurement (number of observed events) given a theory expectation ?” Posterior pdf for λ: “what can I say about the underlying theory (true value of λ) given that I have observed of 4 events ?”
Bayesian: statement on true value of λ Choice of prior P(λ): Assume all values for λ areequally likely (“I know nothing”) Likelihood Probability density function λ (hypothesis) λ (hypothesis) Posterior PDF for λ Integrate to get confidence interval
Ordering rule Option 3 and 4: Bayesian option 1 Bayes central +3.16 68% -1.16 16% 16% option 2 Bayes equal prob. +2.40 Equal likelihood 68% 8.3% 23.5% -1.71
Option 4: Frequentist Poisson λ = 7.16 If λ < 7.16 then probability toobserve 4 events (or less) <16% 16% smallest λ for which P(n≤nobs|λ)= 0.159 +3.16 Poisson -1.91 largest λ fow which P(n≥nobs|λ)= 0.159 λ = 2.09 16% Note: also using data that you did not observe
The options 8 7 6 +2.40 +3.16 +3.16 +2.00 +2.35 5 4 3 -1.71 -1.91 -2.00 -1.68 -1.16 2 1 Bayesiancentral Bayesianequal prob Frequentist Likelihood Poisson Δλ: 4.00 4.03 4.32 4.11 5.07
Think about it and discuss with your colleagues tonight I’ll give the answer tomorrow
The options 8 7 6 +2.40 +3.16 +3.16 +2.00 +2.35 5 4 3 -1.71 -1.91 -2.00 -1.68 -1.16 2 1 Bayesiancentral Bayesianequal prob Frequentist Likelihood Poisson Δλ: 4.00 4.03 4.32 4.11 5.07
ATLAS H 4 lepton peak 4 +3.16 -1.91 Conclusion: - Now you know what RooFit uses • Hope you are a bit confused http://www.nikhef.nl/~ivov/Statistics/PoissonError/ BobCousins_Poisson.pdf Paper with details PoissonError.C Implementation options shown here Ivo_Analytic_Poisson.pdf Analytic properties (inverted) Poisson